

Harris & Ewing Machine Shop 1917
"C.W. Hecox, instructor in machine shop, D.C. public schools. Supervising manufacture of practice shells for Navy at McKinley training school"
Last week, Nature Magazine wrote about a report by Stefano Battiston, Michelangelo Puliga, Rahul Kaushik, Paolo Tasca & Guido Caldarelli, researchers at ETH Zurich, originally published as DebtRank, too central to fail? at the FOC site.
This is how the people at Phys.Org summarize the report:
Team studies the innermost circle of the financial crisis
“Too central to fail” instead of “too big to fail”: whether banks pose a risk to the financial system when they get into distress has more to do with their level of networking than with their size. Economic researchers at ETH Zurich have developed a method to deduce the “systemic importance” of banks from their complex connections within financial networks.
“Between 2008 and 2010 a total of 22 banks formed the innermost circle of the financial crisis. They were so intensely connected with each other through credit relationships, mutual equity investments and financial dependencies that the distress of any single one of them could endanger the entire financial system. [..]
“The paper by the ETH Zurich researchers injects fresh impetus into the debate regarding the systemic importance of banks that are “too big to fail”. A bank becomes systemically important, or “too big to fail”, when its services are irreplaceable and its insolvency would cost the national economy more than its rescue by the state. However, a bank’s size is only one indicator of its importance for the financial system. Even small banks can pose systemic risks if they are closely networked with other financial institutions.
“The identification of such networking risks and interdependent credit risks presents major challenges for science, business and the authorities concerned. For this reason, the European Commission has launched the scientific project “Forecasting Financial Crisis (FOC)”. FOC is financed by the FET OPEN Scheme (“Future and Emerging Technologies Open Scheme”). Its research topic is to understand and possibly forecast systemic risk and global financial instabilities. [..]
“The Federal Reserve data originate from the “emergency loan program” from 2007 to 2010, through which the Fed provided “cheap” money to financial institutions in the USA that were acutely at risk of defaults. At the height of the crisis, the total amount of loans granted climbed to an astonishing USD 1.2 trillion.
“The Federal Reserve published the figures after the US Supreme Court granted the Bloomberg business and financial information and news company the right to inspect the data, since the American financial system had, after all, been restructured using public funds. The data sets from the Federal Reserve and Bloomberg document the residual outstanding debts and the market capitalisation of a total of 407 financial institutions that borrowed emergency loans from the Fed. The size of the loans provides an indication of a bank’s individual debt over equity ratio and of any potential distress or defaults.
“The assessment of the Federal Reserve data showed that, although the various banks got into difficulties at different times, around 30 banks reached the peak of their emergency situation simultaneously at the height of the crisis. Considered over the entire duration of the emergency loan program, it also became apparent that the number of top borrowers at any given moment hovered around a figure of 20. The ETH Zurich researchers then turned their focus towards those 22 institutions that had received more than USD 5 billion in emergency loans on average over the entire crisis period.
Ok, introductions done. I toyed around with a great little widget on the FOC page based on the report, and generated the graphs below.
Now, before you jump to conclusions, please note that the method, in this instance, uses one set of data: the ones, obtained by Bloomberg, after a huge hassle, through the Freedom of Information Act, that cover only the Fed “emergency loan program” from 2007 to 2010. Hence, if you think you see things – such as interdependence between banks – seemingly returning to normal as time progresses, you would be wrong. It's just that the research team ran out of data. They used the Fed numbers merely to provide a demonstration of what their method could achieve. A very important caveat. Let's get back to that after the graphs.
How does it all work? Just think Google. If you can do PageRank, you can do DebtRank. if you have access to the data. Mark Buchanan explains that part for Bloomberg:
How Google Can Avert the Next Financial Crisis
The mathematical insight that turned Google Inc. into a multibillion-dollar company has the potential to help the world avert the next financial crisis. If only banks made public the data required to do the job.
Sixteen years ago, the founders of Google — computer scientists Larry Page and Sergey Brin — introduced an algorithm to measure the “importance” of Web pages relative to any set of keywords. Known as PageRank, it works on the notion that Web pages effectively vote for other pages by linking to them. The most important ones, Page and Brin reasoned, should be those drawing links from many other pages, especially from other really important ones.
If this definition sounds circular, it is. It also captures an authentic reality, which is why respecting it gives far superior results. Page and Brin’s breakthrough involved using mathematics to make it work. The required ideas don’t go much beyond high-school algebra, although it takes lots of computing power to make something as sprawling as the World Wide Web possible.
What could this have to do with finance? Quite a lot. The systemic risk that turned the U.S. subprime-lending crisis into a global disaster is circular, too. We can’t identify it simply by looking for the banks with the most assets or the biggest portfolios of risky loans. What matters is how many links a bank has to other institutions, how strong those links are and how risky those other banks are, not least because they too have links to other risky banks.
Something like PageRank might be just the right thing to cut through it. That’s the argument, at least, made by a team of European physicists and economists in a new study. Their algorithm, DebtRank, seeks to measure the total economic value that would be destroyed if a bank became distressed or went into default. It does so by moving outward from the bank through the web of links in the financial system to estimate all the various consequences likely to accrue from one failure. Banks connected to more banks with high DebtRank scores would, naturally, have higher DebtRank scores themselves.
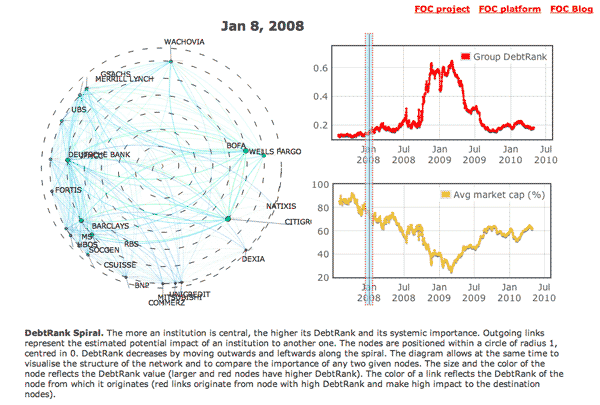
The first set of graphs is the "dry" DebtRank set.
We start out pretty demure in January 2008. Banks' markets caps are still -relatively – high, and debt ranks are low, i.e. no bank is yet central enough to be an overt risk to the system. According to the Fed data set, that is; the full reality, of course, is already much worse at this point.
In July 2008, there's a first blip, with market caps falling and interdependence (debt ranks) surging.

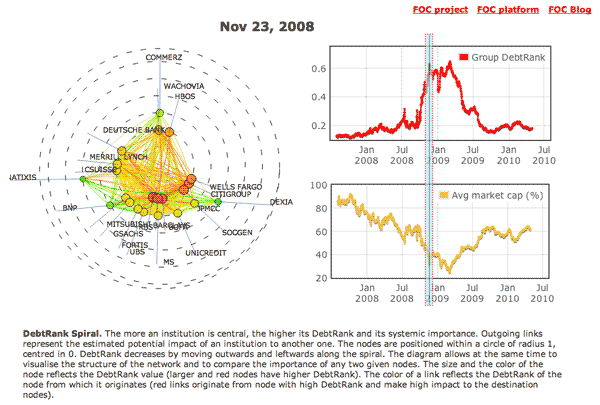
November 2008 brings the real thing. Debt ranks explode, and market caps plunge. No coincidence.
In March 2009, things get even worse. Average market caps reach a bottom, having dropped some 80% or so, and the too-central-to-fail banks are in the middle of the debt rank circle, meaning they can do a lot of harm to the system.
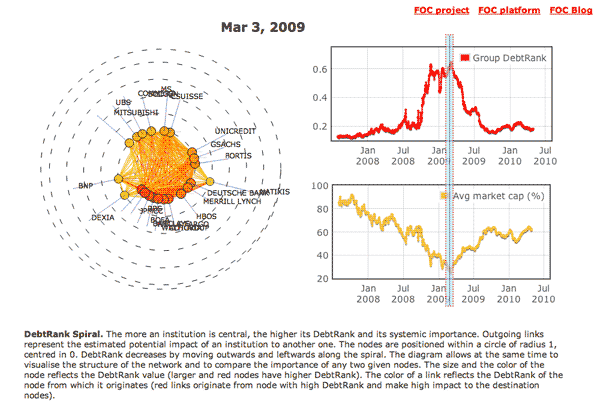
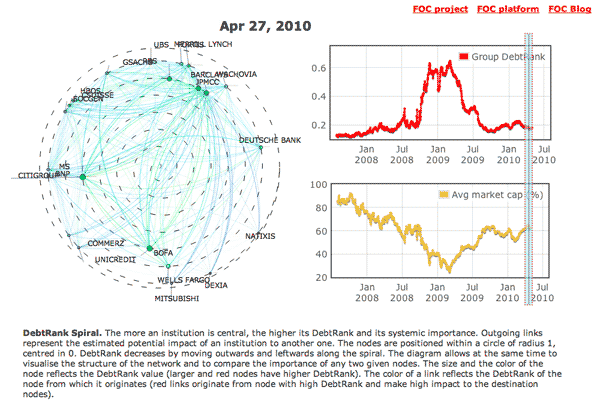
After that there's a sharp drop in interdependence, though it remains above the January 2008 starting point, and a relatively nice rise in average market caps, which, however, stay far below the starting point. up until the end of the data set in mid 2010.
And next, a similar series of graphs, identical timeline, for what the researchers call the Bubble Plot, which they define this way:
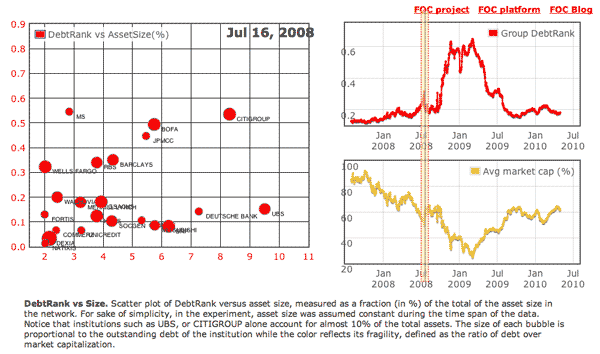
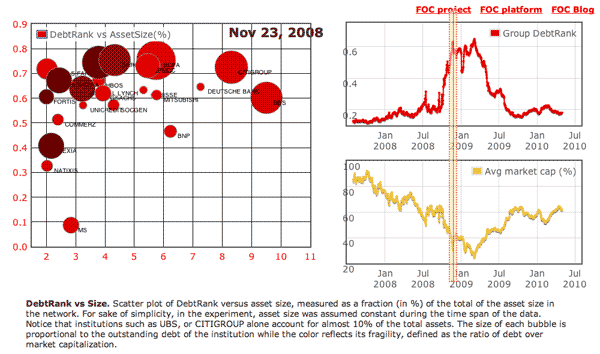
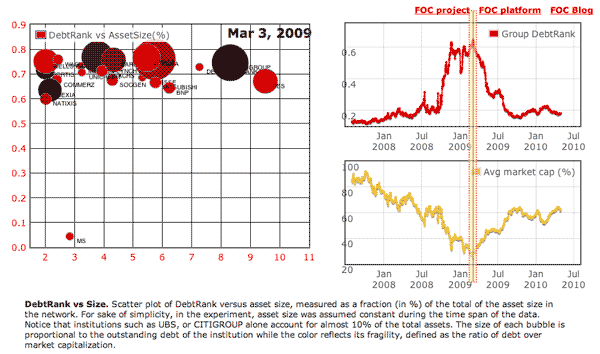
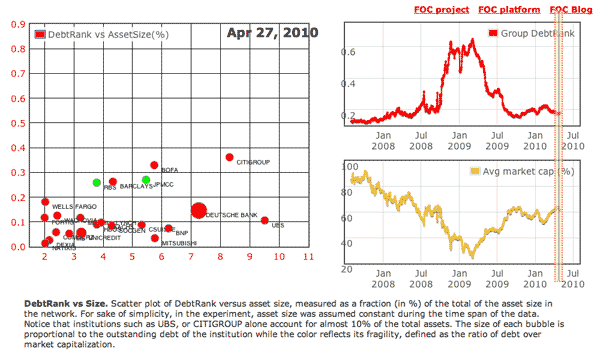
DebtRank vs Size. Scatter plot of DebtRank versus asset size, measured as a fraction (in %) of the total of the asset size in the network. For sake of simplicity, in the experiment, asset size was assumed constant during the time span of the data. Notice that institutions such as UBS, or CITIGROUP alone account for almost 10% of the total assets. The size of each bubble is proportional to the outstanding debt of the institution while the color reflects its fragility, defined as the ratio of debt over market capitalization.
In January 2008, everything seems quiet. Note how Morgan Stanley's lonely at the top.

In the first July 2008 blip, bubbles blow and rise slightly.
In November 2008, it's game on. Increased bubble size, and the bubbles rise, indicating, let's say, increasing volatility.
In March 2009, the ceiling's not high enough anymore. Except for Morgan Stanley …
And a year after that, all seems well again.
What does all this mean? Well, there are plenty of caveats involved, so many that any a voice can say many a thing to discredit the report, and its validity. But in the end, we can only conclude that there is indeed a way to measure the impact of too-big-to-fail and/or too-central-to-fail financial institutions on our economies. Or at the very least that there is one that is worth examining, that very strongly promises to provide us with a way to measure it.
We just need to feed in the data. That won't make the debt go away, but at least we would know how much it is, and, perhaps even more importantly at this point, where it is.
But of course the data are not made available. Not by the banks themselves, and not by the regulators that are supposed to control them. And not by the lawmakers who are the only ones that would have the power to demand they're made available.
Perhaps, for instance in one of the myriad of upcoming LIBOR related courtcases, there's a judge somewhere who demands real numbers. But we can't count on that happening either. We're all basically the combined butts of a worldwide joke.
Still, let no-one anytime anywhere anymore tell you that the whole financial mess we've been sinking into for years now is too complex to measure.
It's not.
It's just that nobody wants to measure economics using scientific standards. Because that would expose it all for the fraud it is, both the economics profession and the financial system as a whole. Here's Matt Buchanan again, putting it very eloquently:
An algorithm alone can’t save the world, and this isn’t the final word on the best way to measure systemic risk. Yet the apparent superiority of the DebtRank approach underscores how our ability to monitor the financial system depends wholly on the availability of data. Currently, most of the information that would be needed to calculate DebtRank or any other similar measure is simply not public.
Imagine a world in which banks and other financial institutions were legally required to disclose absolutely all of their assets and liabilities to central banks, which would in turn make that information public on a website. Regulators — indeed, anyone — would then be able to see the whole network and assess a bank’s situation in full clarity. Anyone so inclined could calculate measures such as DebtRank and assess how much any particular bank is contributing to potential financial instability.
With full transparency, it’s just possible that the core business of lenders would go back to assessing the creditworthiness of borrowers. They would need to do so to maintain a good reputation and to borrow themselves, as any risky loans they made would be known to all. In such a situation, the economist and physicist Stefan Thurner of Medical University of Vienna suggests, “financial institutions would only survive and prosper if they assess the risk of others better than their peers.”
That is a radical idea, so radical it is almost certainly a political nonstarter. But as the British physicist William Thomson, also known as Lord Kelvin, put it back in the 19th century: “What you cannot measure, you cannot hope to improve.” It’s a lasting piece of wisdom.
Yeah, sure. Full transparency. And the day we manage to make pigs fly, they'll be see-through too.
Home › Forums › Here’s The Science That Can Solve The Crisis