

Conventional expansionary monetary policy, which as a rule involves a central bank buying short-term government bonds, is aimed at lowering short-term market interest rates. But when these short-term rates are at or close to zero, QE can be used to purchase assets of longer maturity, aimed at lowering longer-term interest rates “further out on the yield curve”.
One of the Fed’s main QE targets of course has been, and still is, the purchase of mortgage-backed securities, a fact that warrants 1000 questions all by itself (like: why is the Fed still, with the economy allegedly out of the crisis, buying tens of billions or dollars a month worth of commercial housing market debt risk off Wall Street Banks?), but we’ll keep those for later. Suffice it to say that labeling QE a bond-buying program (we see that a lot) is not nearly 100% correct, as the Fed’s own data shows:
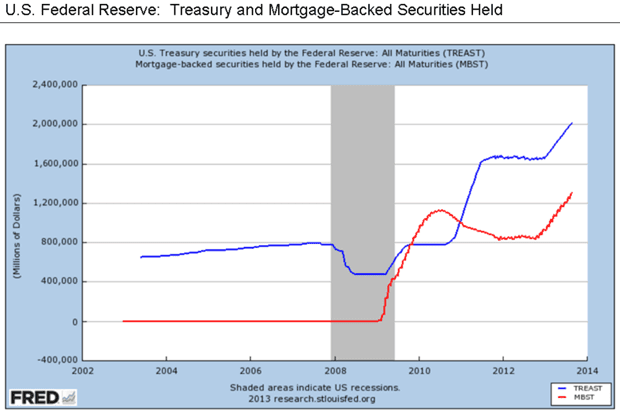
The US Federal Reserve held between $700 billion and $800 billion of Treasury notes on its balance sheet before the recession. In late November 2008, the Federal Reserve started buying $600 billion in mortgage-backed securities. By March 2009, it held $1.75 trillion of bank debt, mortgage-backed securities, and Treasury notes, and reached a peak of $2.1 trillion in June 2010.
Purchases resumed in August 2010 when the Fed “decided” the economy was not growing robustly. After the halt in June, holdings started falling naturally as debt matured and were projected to fall to $1.7 trillion by 2012. The Fed’s revised goal became to keep holdings at $2.054 trillion. To maintain that level, the Fed bought $30 billion in 2- to 10-year Treasury notes every month.
In November 2010, the Fed announced a second round of quantitative easing, buying $600 billion of Treasury securities by the end of the second quarter of 2011. The expression “QE2” became a ubiquitous nickname in 2010.
A third round of quantitative easing, QE3, was announced on 13 September 2012. In an 11–1 vote, the Federal Reserve decided to launch a new $40 billion per month, open-ended bond purchasing program of agency mortgage-backed securities. Additionally, the Federal Open Market Committee (FOMC) announced that it would likely maintain the federal funds rate near zero “at least through 2015.” On 12 December 2012, the FOMC announced an increase in the amount of open-ended purchases from $40 billion to $85 billion per month.
Armed with that memory support, we can turn to McKinsey:
QE and ultra-low interest rates: Distributional effects and risks
There is widespread consensus that the conventional and unconventional monetary policies that world’s major central banks implemented in response to the global financial crisis prevented a deeper recession and higher unemployment than there otherwise would have been. These measures, along with a lack of demand for credit as a result of the recession, contributed to a decline in real and nominal interest rates to ultra-low levels that have been sustained over the past five years.
A new report from the McKinsey Global Institute examines the distributional effects of these ultra-low rates. [..] From 2007 to 2012, governments in the eurozone, the United Kingdom, and the United States collectively benefited by $1.6 trillion both through reduced debt-service costs and increased profits remitted from central banks.
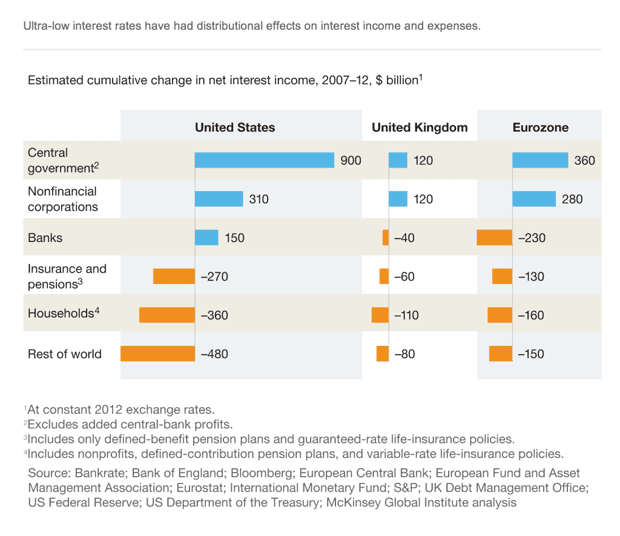
Nonfinancial corporations benefited by $710 billion as the interest rates on debt fell. Although ultra-low interest rates boosted corporate profits in the United Kingdom and the United States by 5% in 2012, this has not translated into higher investment, possibly as a result of uncertainty about the strength of the economic recovery, as well as tighter lending standards. Meanwhile, households in these countries together lost $630 billion in net interest income, although the impact varies across groups. Younger households that are net borrowers have benefited, while older households with significant interest-bearing assets have lost income.
The impact that ultra-low interest rates have had on banks has been mixed. They have eroded the profitability of eurozone banks, resulting in a cumulative loss of net interest income of $230 billion between 2007 and 2012. But banks in the United States experienced an increase in effective net interest margins and a cumulative increase in net interest income of $150 billion. The experience of UK banks falls between these two extremes.
Life-insurance companies, particularly in several European countries, are being squeezed by ultra-low interest rates, so much so that if this environment were to continue many of these insurers would find their survival threatened.
Theoretically, ultra-low interest rates may have resulted in higher asset prices, and this effect may have offset lost interest income for households and other investors. But we find a mixed picture.
Rising bond prices are the flip side of declining yields, and the value of sovereign and corporate bonds in the eurozone, the United Kingdom, and the United States increased by $16 trillion between 2007 and 2012. Investors that mark the value of their assets to market have therefore seen a significant gain on their fixed income investments, at least on paper.
Ultra-low interest rates are likely to have bolstered housing prices by lowering the cost of mortgage credit. This effect is most clearly seen in the United Kingdom, where the majority of mortgages have variable interest rates that have automatically adjusted downward. The impact is less clear in the United States, where the recovery in housing prices has been dampened by an oversupply of housing, high levels of foreclosures, a predominance of fixed-rate mortgages, tightened credit standards, and the prevalence of homes with negative equity whose mortgages cannot be refinanced.[..]
Ultra-low interest rates do appear to have prompted additional capital flows to emerging markets, particularly into their bond markets. Purchases of emerging-market bonds by foreign investors totaled just $92 billion in 2007 but had jumped to $264 billion in 2012. Emerging markets that have a high share of foreign ownership of their bonds and large current account deficits will be most vulnerable to capital outflows if and when central banks begin tapering current policies.
There are likely to be risks ahead whether asset purchases are tapered and interest rates rise or, alternatively, if current monetary policies continue and interest rates remain low. In the first scenario, the benefits gained or losses incurred could be reversed. [..] rising interest rates could lead to a collapse in leveraged trades and could pose a threat to some financial institutions.
Capital flows to emerging markets could reverse. Investors in bond markets forced by accounting rules to mark to market could face large write-downs. Eurozone countries could be caught in a crosswind if rates increase in the United States before they do in Europe, leading to a shift in foreign capital from Europe to the United States. In the second scenario, life insurers and banks in Europe would experience continued erosion in their profitability. A continuation in ultra-low interest rates could also prompt higher leverage and the return of asset-price bubbles in some sectors, especially real estate.
The McKinsey people explain it quite well, but I think it would be good, for one thing, to add some population numbers for perspective. Eurozone population is 334 million, US 317 million, UK 63 million. So you need to multiply UK numbers by about 5 to get comparable (per capita) numbers to the other two. Some things that stand out from that point of view: UK insurance and pensions are much worse of than those in the Eurozone, UK households are even worse than that compared to Eurozone, and the Rest of the World suffers much more from the US than from the others (not surprising, since US Treasuries are everywhere).
Let’s just lift one thing out of that graph, the US government’s $900 billion increase in net interest income. For the simple reason that it gets me thinking. Thinking, for instance, that the national debt would have been almost $1 trillion higher if not for that. But then again, what’s a trillion among friends in the grand scheme of things, right?
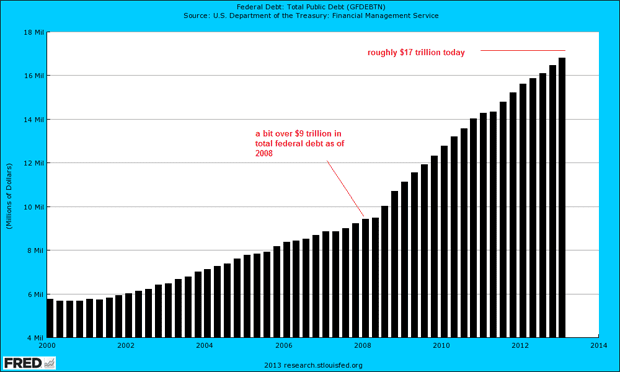
Federal Debt Jumped $409 Billion in October; $3,567 Per Household
The debt of the federal government, which is normally subject to a legal limit, jumped by $409 billion in the month of October, according to the U.S. Treasury. That equals approximately $3,567 for each household in the United States, and is the second-largest one month jump in the debt in the history of the country. In the continuing resolution deal sealed by President Barack Obama and the Republican congressional leadership last month, the legal limit on the federal debt was suspended until February 7 of next year.
The single greatest one-month increase in the federal government’s debt came in October 2008, when Congress enacted the Troubled Asset Relief Program to bail out the financial industry. In that month, the debt subject to the legal limit climbed by about $545 billion.
At the close of business on Sept. 30, 2013, the last day of fiscal 2013, the federal debt subject to limit stood at $16,699,396,000,000. At the close of business on Oct. 31, 2013, the first month of fiscal 2014, the debt subject to limit stood at approximately $17,108,378,000,000.
Thus, during October, the debt increased $408,982,000,000 – or about $3,567 for each of the 114,663,000 households the Census Bureau estimates there are in the United States.
From May 17, when the Treasury was approaching the previous debt limit, until Oct. 17, when Congress enacted the CR suspending the debt limit until February, the Treasury reported that the debt closed each business day at $16,699,396,000,000 – or about $25 million below the then-legal-limit of 16,699,421,095,673.60.
Got to love that last bit: though the debt kept rising, the Treasury merrily reported it as the exact same for 5 months. Who needs the truth when you can just as easily fake it?
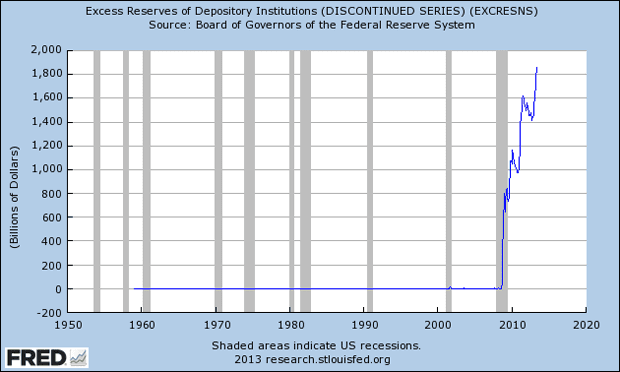
So how did the banks do? We can see a direct reflection of the Fed purchases of bonds and MBS, which we saw in the first graph, in this one:
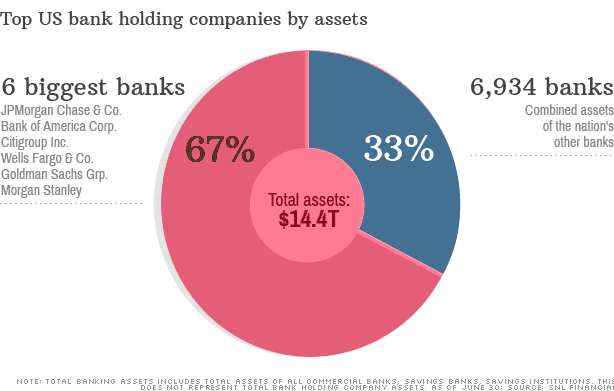
By every measure, the big banks are bigger
Assets at the six largest U.S. banks are up 37% from five years ago. What happened?
One third of all business loans this year were made by Bank of America. Wells Fargo funds nearly a quarter of all mortgage loans. And held in the vaults of JPMorgan Chase is $1.3 trillion, which is 12% of our collective cash, including the payrolls of many thousands of companies [..]
A lot has changed since the financial crisis. A number of large banks and Wall Street firms have disappeared. There are new regulations in the works meant to limit risky trading and bring derivatives that compounded the financial system’s losses into regulated markets. Subprime lending has been coming back recently, but it’s still a fraction of what it once was.
But at least one of the widely recognized causes of the financial crisis is not only still around, it has perhaps gotten worse. By every measure I can think of, and I have tried a bunch, the big banks are bigger than they were five years ago, at the dawn of the financial crisis. [..]
The six largest banks in the nation now have 67% of all the assets in the U.S. financial system, according to bank research firm SNL Financial. That amounts to $9.6 trillion, up 37% from five years ago. And the big banks seem to be getting better at acquiring assets all the time. The overall growth of assets in the system in the same time is up just 8%.
The biggest bank in the nation, JPMorgan, has $2.4 trillion in assets alone – the size of England’s economy. And JPMorgan is seven times larger than the nation’s No. 10 bank U.S. Bancorp, which itself has $350 billion in assets – along the lines of Austria — and at this point is probably part of the TBTF club as well. Also way up: Profits. The four biggest banks in the U.S. alone, which along with JPMorgan include Bank of America, Citigroup, and Wells Fargo, made collectively nearly$45 billion in the first six months of the year, nine times what those same banks made five years ago.
I’ll throw in a few numbers from Michael Snyder:
Too Big To Fail Is Now Bigger Than Ever Before
• JPMorgan Chase
Total Assets: $1,948,150,000,000 (just over 1.9 trillion dollars) Total Exposure To Derivatives: $70,287,894,000,000 (more than 70 trillion dollars)
• Citibank
Total Assets: $1,306,258,000,000 (a bit more than 1.3 trillion dollars) Total Exposure To Derivatives: $58,471,038,000,000 (more than 58 trillion dollars)
• Bank Of America
Total Assets: $1,458,091,000,000 (a bit more than 1.4 trillion dollars) Total Exposure To Derivatives: $44,543,003,000,000 (more than 44 trillion dollars)
• Goldman Sachs
Total Assets: $113,743,000,000 (a bit more than 113 billion dollars – yes, you read that correctly) Total Exposure To Derivatives: $42,251,600,000,000 (more than 42 trillion dollars)
That means that the total exposure that Goldman Sachs has to derivatives contracts is more than 371 times greater than their total assets.
Michael Snyder’s right: too big to fail has only become bigger, and therefore even harder to fail. Courtesy of quantitative easing. Well, and creative accounting.
But that is not at all how QE has persistently been presented to the people. It’s presented both by Bernanke and by his footsoldiers as an effort to heal the American economy and create jobs. For which there is so little evidence that they get away with throwing ever more money at the by now too bloated to fail banks, and always under the same guise. And as the American people seem to believe them, banks and investors are just happy with all the free money and low interest rates. It’s as if nobody pays, and if someone does pay, who cares, they don’t raise their voices, do they?
One of Bernanke’s footsoldiers is Janet Yellen, and she’s set to take over the Fed soon. Here are some pieces from her Senate hearing speech last week:
It has been a privilege for me to serve the Federal Reserve at different times and in different roles over the past 36 years, and an honor to be nominated by the President to lead the Fed as Chair of the Board of Governors.
The past six years have been challenging for our nation and difficult for many Americans. We endured the worst financial crisis and deepest recession since the Great Depression. The effects were severe, but they could have been far worse. Working together, government leaders confronted these challenges and successfully contained the crisis. Under the wise and skillful leadership of Chairman Bernanke, the Fed helped stabilize the financial system, arrest the steep fall in the economy, and restart growth.
For these reasons, the Federal Reserve is using its monetary policy tools to promote a more robust recovery. A strong recovery will ultimately enable the Fed to reduce its monetary accommodation and reliance on unconventional policy tools such as asset purchases. I believe that supporting the recovery today is the surest path to returning to a more normal approach to monetary policy.
In the past two decades, and especially under Chairman Bernanke, the Federal Reserve has provided more and clearer information about its goals. Like the Chairman, I strongly believe that monetary policy is most effective when the public understands what the Fed is trying to do and how it plans to do it. At the request of Chairman Bernanke, I led the effort to adopt a statement of the Federal Open Market Committee’s (FOMC) longer-run objectives, including a 2% goal for inflation. I believe this statement has sent a clear and powerful message about the FOMC’s commitment to its goals and has helped anchor the public’s expectations that inflation will remain low and stable in the future.
We have made progress in promoting a strong and stable financial system, but here, too, important work lies ahead. I am committed to using the Fed’s supervisory and regulatory role to reduce the threat of another financial crisis. I believe that capital and liquidity rules and strong supervision are important tools for addressing the problem of financial institutions that are regarded as “too big to fail.”
Yellen’s not going to change a thing. It’s steady as she goes, everything on red. The banks can rest assured, the money will keep on coming their way. The banks that are bigger than they ever were, and by now form a risk to the security of the country, not just the economy. JPMorgan is now as big as the entire UK economy. Can’t let it fail. And if you can’t let it fail, you’re going to find yourself giving in more and more. Not a situation any society should put itself in.
Yellen has been in and out of the Fed system since 1977. She was a member of the Fed’s Board of Governors from 1994-’97, and became chair of Clinton’s Council of Economic Advisers from 1997-’99. She was President of the San Francisco Fed from 2004-’10. In other words, when Greenspan, Summers and Rubin opened up the floodgates to hand Wall Street full access to every dime the American people ever earned, Janet Yellen was on her post and happily went along with it all.
And now she’s being installed to make sure the music keeps playing on Wall Street. But once you include the games played with US unemployment numbers, like for instance the Labor Participation Rate, unemployment is a lot closer to 10% than it is to 7.3%. So why would you still believe that the Fed is looking out for American jobs, or that QE is the best way to do that?
By 2012, Americans had lost $630 billion just in net interest income, some $2000 per capita. Today, that amount is undoubtedly higher. And Janet Yellen, faithful puppet of the architects of America’s worst ever financial crisis, will do her best to make sure it keeps on rising.
Why doesn’t America recognize the failure of QE and try something different? $85 billion a month, over $1 trillion a year, is about $3000 for every American, or close to $10,000 per household. If that were handed not to banks, but to these households, and it could achieve the same economic efficiency that foodstamps have, i.e. they create $1.7 worth of – primarily local – economic activity for every $1 they’re worth, the average household would have $10,000 extra to spend, and the benefit to the economy would be $17,000. That couldn’t fail to create jobs.
It’s theoretical, of course, and things being as they are, it’s almost certain that it will remain a theory only. But even if you would take just, let’s say, 10-20% of the amounts presently spent to relieve too big to fail but already failed anyway banks of their mortgage debt risk, that would still do a lot more to revive the economy than all of QEs relief does. Not that that’s hard, mind you, since QE has only made matters worse for the people. That’s what that graph from McKinsey tells us.
Photo top: Toni Frissell John F. Kennedy wearing beatnik sunglasses 1957
Home › Forums › QE, The People And The Damage Done