

Harris & Ewing “Iced T, Washington, D.C.” Jan 28, 1922
I don’t think that to make my case in this point, I need to state my opinion, but I will add a few words: There is nothing wrong with income and wealth inequality by itself, though I fail to see its benefits for society. The freedom to become richer than God is a mistaken case of freedom; if that’s how you express your longing to be free, you have an empty life, and why empty lives should be encouraged I can’t tell. Seeking to challenge God in terms of physical wealth is also potentially harmful in myriad ways, for human beings and for the planet they live on.
But that doesn’t mean income and wealth inequality is necessarily a bad thing; it only becomes that if and when it leads to misery and poverty. And it would seem, judging from history, that to prevent misery from befalling people for economic reasons, you will need to come up with a way to distribute the wealth available in your society, and in larger spheres, that makes sure no children lay dying by the side of the road, or go without food for days.
One last piece of my own opinion: No, I don’t like seeing the young, the old, the sicker and weaker amongst us being hungry and miserable. But more importantly, I don’t believe a society can last long that allows misery to spread too wide amongst its members. And I think that those who lean towards social Darwinism notions (invariably while being on the “right” side of the divide) should not complain when the weak come and bash their skulls in one day.
Two articles that touch on this are “Making the Economic Case for More Than the Minimum Wage” by Bloomberg’s Peter Coy and “Here’s What ‘Income Equality’ Would Look Like” by the Tax Foundation’s Scott Hodge, published by the Wall Street Journal.
A few bits from Coy’s minimum wage case (the – well researched – article is much longer):
[..] … a survey last year of leading economists [found] that 47% felt the good effects of a $9 minimum wage—the figure on the table at the time—would outweigh any bad ones. Only 11% disagreed. Last month seven Nobel prize-winning economists and four former presidents of the American Economic Association, along with more than 600 other economists, signed a letter to Congress urging passage of the $10.10 floor.
It’s an ambitious target, $10.10: Correctly adjusting for inflation using the Bureau of Labor Statistics’ best historical data series, it would be the highest minimum wage ever—more potent in buying power than the $1.60 mandated wage in 1968, when middle-class jobs were plentiful, factories hummed, and labor unions ruled. It’s just more than half of the $19.55 median wage for full-time workers, which would put the U.S. minimum-to-median ratio back in sync with that of other rich, industrialized countries. [..]
Even people who earn multiples of $7.25 can relate. Adjusted for inflation, Americans’ real incomes have fallen 8% since the start of 2000, according to a December calculation by Sentier Research of the seasonally adjusted median household income. Research by University of Ottawa economist Miles Corak shows that, among wealthy nations, the U.S. has the third-lowest social mobility, besting only Italy and the U.K. [..]
Paul Osterman, a Massachusetts Institute of Technology labor economist who signed the January letter to Congress endorsing $10.10, says, “To jump from $7.25 to $15 would be a long haul. That would in my view be a shock to the system.” Because a $15 minimum wage is outside the realm of experience in the U.S. economy, Osterman says, “anyone who talks about its effect is kind of making things up.” [..]
Amy Glasmeier, an MIT regional planning professor, has created a “living wage” calculator that among other things figures in the rent on an apartment at the (relatively high) 40th percentile of local market costs. It puts the living wage for a single parent with two children in San Francisco at $29.66 an hour.
Maricela Flores, a Mexican immigrant, earns $8 an hour washing floors and cleaning bathrooms at a department store in Shakopee, Minn. She says she has to choose sometimes between meat and fruit when shopping for herself and the four of her children who share her trailer home. According to MIT’s calculator, the living wage for a single parent with three children in Shakopee is $33.28 an hour. For Flores, that’s a fantasy.
You see the problem. Social justice demands a minimum wage of more than $20 an hour. Economics won’t allow for one much higher than $10. The way out of the dilemma is to acknowledge that the minimum wage is being called on to do more than it reasonably can. A minimum-wage job shouldn’t be any family’s primary means of support, yet in many cases it is: In 2012, 76% of workers earning $7.25 an hour or less were aged 20 or older.
It’s better to regard the minimum wage as one part of the safety net. Raising it reduces the amount of money taxpayers have to spend for government aid. A 2013 Congressional Budget Office study found that the federal government gives about $8,800 per household in annual assistance to the lowest fifth of households by income but only about $4,000 to the next fifth (households averaging $35,500 in market income, which is $17 an hour full-time). The earned income tax credit – supplementary income for low-paid workers – is a conservative favorite, but it inadvertently subsidizes employers by allowing them to reduce how much they need to pay to attract workers. The minimum wage prevents those employers from reducing too much.
Now let’s compare this with Hodges’ contradictory view about ‘equality’. First, though, let me point out a seeming disparity: Coy states that “.. the federal government gives about $8,800 per household in annual assistance to the lowest fifth of households by income ..”, while Hodge writes: “A typical American family in the lower income quintile [..] gets $21,158 more in spending than they pay in taxes.” I can’t tell where the difference comes from. What I can tell is Hodge has the tendency to resort to big numbers in trying to make his view come across.
According to the Tax Foundation study’s estimate, the average market income for American families in 2012 was $81,600. (Market income includes wages, business and capital-gains income, and health and retirement benefits, but excludes transfers.) A typical American family in the lower income quintile, on the other hand, has an average market income of $9,560 and gets $21,158 more in spending than they pay in taxes. Thus we would need to give them roughly $50,882 more in federal transfers to raise their overall income to the average market income of U.S. families.
Well, Scott, or you could raise their incomes. An average market income of less than $10,000 is very low.
A family in the middle quintile has on average a market income of $56,885 and gets $7,376 more in spending than they pay in taxes. (Although these families are in the middle fifth of the population, their average incomes are actually below the national average.) So to raise their overall income to the U.S. market-income average, the government would need to give them $17,339 in transfer payments above what they are currently getting.
Naturally, for families in the first three quintiles to gain, those in the top two quintiles have to lose. Families in the fourth quintile have an average market income of $100,240 and pay $4,089 more in taxes than they receive in spending. Thus, we would need to take an additional $14,551 from these families to bring their market incomes down to the national average.
Families in the top fifth have an average market income of $311,400 and pay $65,573 more in taxes than they receive in spending. Thus we would need to take an additional $164,227 from them in higher taxes to lower their market incomes to the national average.
Those are some big numbers alright. But Hodge, obviously, plays a whole platoon of straw men here. He uses those big numbers to conceal that what he’s calculating is something nobody is asking for. He plays the fear card where others, like Coy, seek only to find the justice one. And I know that some of you will say: he’s merely doing the clean dry math, but that’s not so. You see, he starts of his WSJ piece like this:
President Obama has talked a lot recently about reducing income inequality. Yet he neither acknowledges how much money the government is redistributing, nor how much more would be needed to close the income gap. Perhaps that’s because the project would require redistribution on a staggering scale.
See? Hodge is dishonest, and suggests in a hidden straw man fashion that Obama wants to take $164,227 from families that make less than twice that. And that’s simply not true. And I don’t say that because I feel an sudden urge to defend Obama. Nor does anyone suggest handing out an additional $50,882 to families who make less than a quarter of that. But Hodge makes it appear that they do. That a different distribution of wealth, and different ways of taxation, must inherently lead to communism.
And between his lines he feeds you the idea that what he starts out with in his model is the “normal”. But is that true? What is the normal? Is today’s ‘new normal’ really the normal? I don’t think that’s such a hard issue to crack. Provided we leave ideology at the door.
Let’s start with historic US income tax rates:
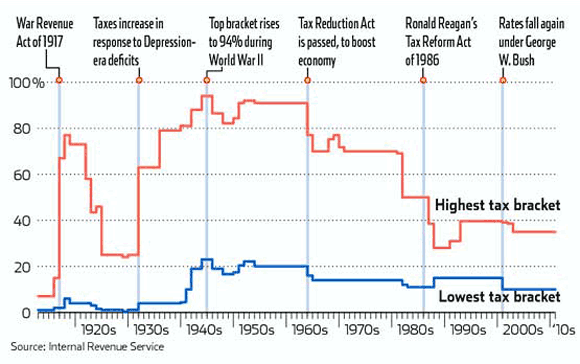
While they’re not at the historic low of 25% in the 1920s (let alone the 5% of the 1910s), today’s 35% highest tax bracket is still very low, comparatively. By the way, anyone notice that the three periods with the lowest tax brackets for the rich all led America into a depression/recession? And that the first two led it into world wars? Repeat after me: The lowest tax rates for higher incomes lead to crisis.
You know what the most prosperous time in US history was? Mid 1950s to late 1970s. Average highest income tax bracket in that period? About 80%. I think the graph is plenty clear.
How about the redistribution of wealth, taxes? How about the complaints that the poorest already get so much in assistance? It went down by some 30% in 10 years. Yes, that means that before that time, a comparatively larger part of taxes paid by the rich went to the poor. It was brought down by 30%.
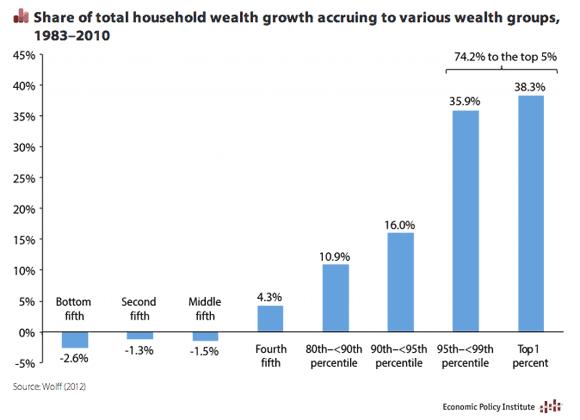
And how was added wealth divided? Need you ask?
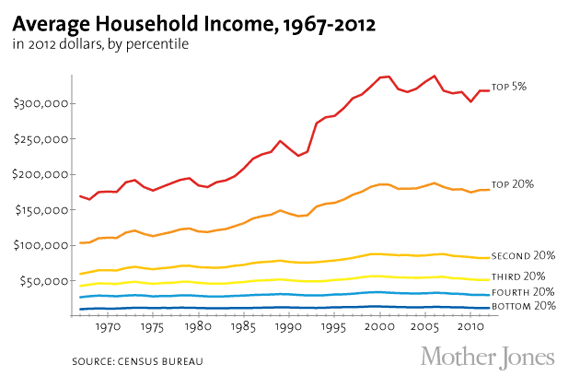
How about income gains? Well …
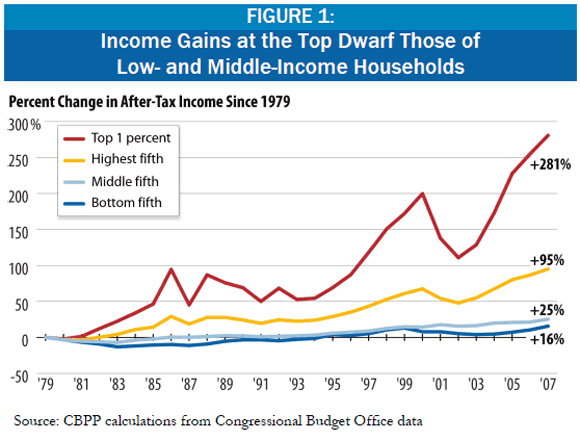
Or average income? You know what, the lower 60% of America has, when counted in 2012 dollars, not seen its income rise at all since 1965 (!!) That is a period of almost 50 years … You know what has gone up in that time, though? And no, it’s not only the income of the top. Another thing that’s gone up, and hugely. is people’s debt. So this graph doesn’t yet paint the full picture.
And finally, look at the relative share of income and wealth of the top 0.1% of Americans from 1915 to 2005:
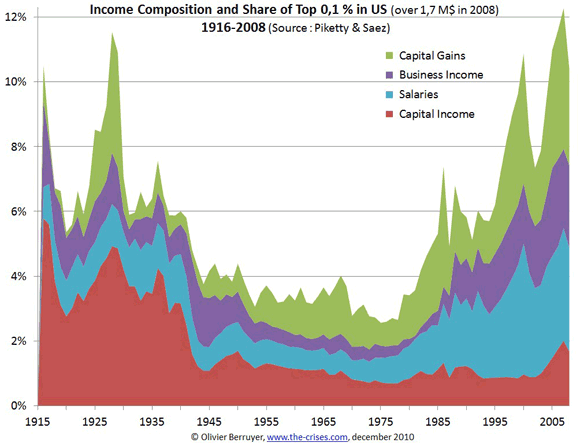
Look, again, at that period from the mid 1950s to the late 1970s, America’s most prosperous era. There seems to be only one possible conclusion. The US must raise its minimum wage, so all those big numbers from the Tax Foundation get much smaller. And it must simultaneously hike income tax rates for the wealthiest to at least 60% from the present 35%. Because if it doesn’t, the inevitable outcome seems to be going to war. Which the rich shouldn’t want either, because the last time that happened, their taxes went to 90%, and the one before that, 75%.
I don’t know that it’s necessary, or even helpful, to end this with a conclusion. I think everyone can draw their own. The graphs make it all so obvious, it’s exceedingly hard to miss.
The discussion about (in)equality and minimum wages is as distorted as the numbers themselves are. That’s what makes this a hard topic. Remove the distortion, and it’s real easy. Ideologies may still differ, but the numbers don’t lie.


Recovery? Where? Blame it on the snow.
• US Malaise Mounts as Spending Slips (WSJ)
An economic recovery that looked poised to lift off is reverting to its characteristic sluggishness as gauges of shopping activity, job creation, wage growth and factory output flash yellow. And it’s more than just the weather that’s behind the malaise.
The latest warning sign came Thursday in a Commerce Department report showing a 0.4% drop in retail sales in January from a month earlier, the sharpest decline in a year and a half. Americans cut back on a broad swath of goods including cars, furniture and clothing. The unexpected pullback by consumers – sales also declined in December – followed last week’s reports showing weak job creation for a second month and a suddenly slower factory-sector expansion.
While the latest blame for the economy’s disappointing performance is falling on severely cold weather and winter storms that have gripped much of the nation in recent weeks, most economists suggest the weather will have only a modest effect. “It’s not really a viable argument to say that weather was the cause of that pullback in January, because the declining trend was so clear over the past several months,” said Lindsey Piegza, chief economist at Sterne Agee. “The real fundamentals suggest the consumer has to pull back.”
After the economy accelerated in mid-2013, many economists had warned that growth would be tempered a bit early this year as firms whittled down inventories that had built up quickly. Other factors suggest the weather is playing only a supporting role in the recent weakness. Home sales, for instance, may have been hit by the cold weather recently. But they’d been restrained by higher mortgage rates since the middle of last year.
The overall economy remains plagued by financially constrained households and skittish businesses, two persistent features of an economic recovery that’s approaching the end of its fifth year.
Americans’ wages barely kept up with the pace of inflation over the past year. Consumers are dipping into savings to maintain their spending, a practice economists have long warned is unsustainable. Meantime, weakness in overseas economies is hurting U.S. exports and hitting the nation’s factories.
More than 10 million Americans workers remain jobless, including 3.6 million who have been jobless for six months or longer. Many people are working part time or in low-wage fields. Millions more working-age Americans are out of the workforce altogether, leaving the share of Americans who are working or looking for work at nearly 35-year lows.
Again: snow.
• US Retail Sales Unexpectedly Fell in January (Bloomberg)
Sales at U.S. retailers declined in January by the most since June 2012 amid bad weather and uneven progress in the labor market, signaling the economy was off to a slow start in 2014. The 0.4% decrease followed a revised 0.1% drop in December that was previously reported as an increase, according to Commerce Department figures released today in Washington. Jobless claims unexpectedly climbed last week, other data showed.
Slower employment and wage growth the last two months, along with colder-than-normal temperatures, caused American shoppers to pull back after the strongest consumer spending pace in three years in the final quarter of 2013. Economists at Goldman Sachs Group Inc., Credit Suisse and Morgan Stanley were among those reducing tracking estimates for first-quarter growth.
“It’s not looking good for consumer spending,” said Guy Berger, a U.S. economist at RBS Securities Inc. in Stamford, Connecticut, and the top sales forecaster over the last two years, according to data compiled by Bloomberg. “Even if you have some modest improvement in the pace of employment growth, that’s not enough to generate a huge improvement in income.”
More Americans than forecast filed applications for unemployment benefits last week, Labor Department figures showed today. Jobless claims increased by 8,000 to 339,000 in the week ended Feb. 8. The median projection in a Bloomberg survey of economists called for 330,000 claims.
The expiration of emergency jobless benefits probably also played a role in holding back sales. Federal benefits for the long-term unemployed expired on Dec. 28, shutting off aid to more than a million people. Legislation to extend the program for three months, at a cost of $6.4 billion, is stalled in the Senate. More than 3.6 million people have been without work for 27 weeks or longer, according to the Labor Department.
Another great one from Taibbi. Phil Gramm and his wife destroyed a lot of America.
• The Vampire Squid Strikes Again: The Most Devious Scam Yet (Matt Taibbi)
Call it the loophole that destroyed the world. It’s 1999, the tail end of the Clinton years. While the rest of America obsesses over Monica Lewinsky, Columbine and Mark McGwire’s biceps, Congress is feverishly crafting what could yet prove to be one of the most transformative laws in the history of our economy – a law that would make possible a broader concentration of financial and industrial power than we’ve seen in more than a century.
But the crazy thing is, nobody at the time quite knew it. Most observers on the Hill thought the Financial Services Modernization Act of 1999 – also known as the Gramm-Leach-Bliley Act – was just the latest and boldest in a long line of deregulatory handouts to Wall Street that had begun in the Reagan years.
Wall Street had spent much of that era arguing that America’s banks needed to become bigger and badder, in order to compete globally with the German and Japanese-style financial giants, which were supposedly about to swallow up all the world’s banking business. So through legislative lackeys like red-faced Republican deregulatory enthusiast Phil Gramm, bank lobbyists were pushing a new law designed to wipe out 60-plus years of bedrock financial regulation. The key was repealing – or “modifying,” as bill proponents put it – the famed Glass-Steagall Act separating bankers and brokers, which had been passed in 1933 to prevent conflicts of interest within the finance sector that had led to the Great Depression. Now, commercial banks would be allowed to merge with investment banks and insurance companies, creating financial megafirms potentially far more powerful than had ever existed in America.
All of this was big enough news in itself. But it would take half a generation – till now, basically – to understand the most explosive part of the bill, which additionally legalized new forms of monopoly, allowing banks to merge with heavy industry. A tiny provision in the bill also permitted commercial banks to delve into any activity that is “complementary to a financial activity and does not pose a substantial risk to the safety or soundness of depository institutions or the financial system generally.”
Complementary to a financial activity. What the hell did that mean? “From the perspective of the banks,” says Saule Omarova, a law professor at the University of North Carolina, “pretty much everything is considered complementary to a financial activity.”
Fifteen years later, in fact, it now looks like Wall Street and its lawyers took the term to be a synonym for ruthless campaigns of world domination. “Nobody knew the reach it would have into the real economy,” says Ohio Sen. Sherrod Brown. Now a leading voice on the Hill against the hidden provisions, Brown actually voted for Gramm-Leach-Bliley as a congressman, along with all but 72 other House members. “I bet even some of the people who were the bill’s advocates had no idea.”
Gillian Tett states the obvious. As in China, financial power in the US is no longer in the hands of the old guard. Shadows are a better place to rule from.
• The real titans of finance are no longer in the banks (FT)
If the mighty J Pierpont Morgan were reincarnated in New York today, who might he be? Jamie Dimon, the man who is now chief executive of JPMorgan, the bank that shares the great man’s name? Or might Morgan prefer to return as Stephen Schwarzman or Leon Black, respectively the heads of Blackstone and Apollo, two gigantic private equity firms?
I would bet that his second coming would be as Mr Schwarzman or Mr Black. Never mind the fact that these “alternative asset” managers – as they prefer to call themselves now – are more entrepreneurial and swashbuckling these days than bank CEOs. And ignore the $100m plus in potential renumeration – including salary, dividends and shared profits – drawn by both Mr Schwarzman and Mr Black, which makes Mr Dimon’s recent $20m package seem almost modest.
What is really striking is the volume of non-bank financing that is quietly being supplied to western economies with minimal regulatory scrutiny – a trend on which my colleague Henny Sender has reported extensively. The “non-bankers” who provide it now matter as much as the bankers, and they appear to be having more fun. Results released in the past two weeks by asset management groups illustrate the point. Last decade, Goldman Sachs’ return on equity peaked at 40 per cent. Last year it was just 11%. Meanwhile, KKR’s return on equity was 27.4% in 2013 – a margin that the banks can only dream of.
These groups’ recent profits were boosted by sales of companies they acquired several years ago. But today they are branching out beyond turnround activity, partly because there are fewer new deals around, and jumping into areas that were the terrain of banks: credit and property.
Only a quarter of Apollo’s $160bn-odd business is now focused on private equity. It has recently gobbled up so many corporate loans and bonds that its credit portfolio has exploded to more than $100bn, compared to just $4bn seven years ago. At Blackstone and KKR the switch is less dramatic: according to Bloomberg’s calculations, credit is just a quarter of their portfolios. But they are shifting focus too. Just last week, Blackstone announced plans to start extending mortgage credit as part of its property business.
Of course, a $100bn credit book is still smaller than that of JPMorgan. It is bigger than many midsized American banks, however. And the asset managers’ economic footprint is expanding in other ways too. Blackstone’s portfolio companies, for example, now have 600,000 employees and $79bn of revenue. “The private equity houses today look like merchant banks were 100 years ago,” observes Jes Staley, formerly head of JPMorgan’s investment bank (who now works at BlueMountain Capital, an investment group). “They are very big and powerful.”
This may not be entirely desirable. Non-banks are swelling in size because they do not face the same regulatory burdens as banks, allowing them to turn a profit on business that banks now find uneconomic. This worries regulators. The US Office of the Comptroller of the Currency recently warned that the activities of non-banks has fuelled a boom in risky corporate loans – and warned banks not to “skirt rules” by teaming up with non-banks to create more credit.
But the good news about non-banks is that they are not plagued with the maturity mismatches of real banks; they do not take retail deposits but attract long-term funding instead. That reduces systemic risk; or so regulators hope. And what nobody can deny – even those who dislike this regulatory arbitrage – is that non-banks’ business has swelled due to unmet demand. After all, the only reason that non-banks can turn a profit by extending credit is that banks are no longer supplying enough credit to risky endeavours, such as small companies.
The great irony of the post-2008 regulatory clampdown is that by forcing established banks to become safer, regulators have given wings to a gaggle of new financial players – with potentially unpredictable consequences. Call it, if you like, a triumph of Wall Street’s entrepreneurial spirit; or testament to its unseemly ability to run rings around rules. Either way, financial arbitrage is once again the theme of the day, and it is producing the kind of profits that J Pierpont Morgan would have savoured.
See above.
• Making the Economic Case for More Than the Minimum Wage (BusinessWeek)
In his January 2014 State of the Union address, President Obama called for a new federal minimum wage of $10.10 an hour. The year before, in the same speech, he proposed a $9 minimum wage. Obama didn’t provide an economic rationale for the increase so much as a marketing one, ad-libbing: It’s easy to remember: 10-10! If instant recall is the primary goal, why not $10.04, in a salute to Smokey and the Bandit? Or $10.66, the year of the Norman conquest of England? Or better still, $10.99 after the IRS form?
Obama isn’t the only party guilty of loose thinking about the minimum wage. His bid to raise the floor from the current $7.25, set in 2009, has reheated a simplistic, dumb-as-rocks debate that’s dragged on for decades. Fiscal conservatives and the libertarian wing of the Republican Party reflexively view any increase in the minimum wage as a job killer. Labor unions and liberal Democrats cavalierly suggest that, oh, doubling it! sounds about right to them.
Raising the minimum wage is certain to be a wedge issue for Democrats in the midterm elections because it’s the rare redistributive measure that enjoys broad popular support. A Washington Post-ABC News poll in December found that two-thirds of Americans support a minimum wage increase. But to opponents, it smacks of Big Government heavy-handedness. That explains why politicians on both sides are loudly reminding their constituents of their ideologies. The back and forth, however, fails to address the real issues: What’s the right minimum wage? And what’s the fairest way for the world s largest economy historically, a beacon of social mobility, to arrive at it?
The first question is a bit easier to answer. The original minimum wage, 25¢ an hour, was born in 1938 under similar conditions of economic hardship and class resentment. Labor Secretary Frances Perkins and President Franklin Roosevelt had fought for it for five years. The night before signing the Fair Labor Standards Act, in a radio fireside chat, Roosevelt said, Do not let any calamity-howling executive with an income of $1,000 a day tell you that a wage of $11 a week is going to have a disastrous effect on all American industry.
Free-market conservatives argued during the Depression, and do now, that it’s wrong in principle for government to interfere in work contracts between consenting adults. Even if you don’t embrace laissez-faire libertarianism, they make a more pragmatic case: The minimum wage is counterproductive. It steals jobs from the most vulnerable people those who could get hired at $5 an hour, say, but not at $7.25 or $10.10.
The argument that a wage floor kills jobs has been weakened by careful research over the past 20 years, beginning with a seminal 1994 study by David Card of the University of California at Berkeley and Alan Krueger of Princeton. The duo compared employment in fast-food restaurants in New Jersey, which had just enacted a minimum wage hike, with fast-food restaurants across the border in Pennsylvania, which had kept its rate the same. The result: no reduction in New Jersey’s employment rolls.
The Card-Krueger study touched off an econometric arms race as labor economists on opposite sides of the argument topped one another with increasingly sophisticated analyses. The net result has been to soften the economics profession’s traditional skepticism about minimum wages. If there are negative effects on total employment, the most recent studies show, they appear to be small. Higher wages reduce turnover by increasing job satisfaction, so at any given moment there are fewer unfilled openings. Within reasonable ranges of a minimum wage, the churn-reducing effect seems to offset whatever staff reductions occur because of higher labor costs. Also, some businesses manage to pass along the costs to customers without harming sales.
• Here’s What ‘Income Equality’ Would Look Like (WSJ)
According to the Tax Foundation study’s estimate, the average market income for American families in 2012 was $81,600. (Market income includes wages, business and capital-gains income, and health and retirement benefits, but excludes transfers.) A typical American family in the lower income quintile, on the other hand, has an average market income of $9,560 and gets $21,158 more in spending than they pay in taxes. Thus we would need to give them roughly $50,882 more in federal transfers to raise their overall income to the average market income of U.S. families.
A family in the middle quintile has on average a market income of $56,885 and gets $7,376 more in spending than they pay in taxes. (Although these families are in the middle fifth of the population, their average incomes are actually below the national average.) So to raise their overall income to the U.S. market-income average, the government would need to give them $17,339 in transfer payments above what they are currently getting.
Naturally, for families in the first three quintiles to gain, those in the top two quintiles have to lose. Families in the fourth quintile have an average market income of $100,240 and pay $4,089 more in taxes than they receive in spending. Thus, we would need to take an additional $14,551 from these families to bring their market incomes down to the national average.
Families in the top fifth have an average market income of $311,400 and pay $65,573 more in taxes than they receive in spending. Thus we would need to take an additional $164,227 from them in higher taxes to lower their market incomes to the national average.
Since there are millions of families in each quintile, these numbers begin to add up. To guarantee everyone in America an average income, the federal government would have to take an additional $2.4 trillion in income from the top 40% of families—in one year. This would bring the total amount of income redistributed from the top to nearly $4 trillion.
Many people believe the “rich” can afford to pay higher taxes since they command a disproportionate share of the nation’s income. However, the current amount of redistribution already takes 21% of the top quintile’s income. That would have to soar to 74% to make every family in America “average.”
These are the missing pieces of the current inequality debate. To recap: Current federal tax-and-spending policies combine to redistribute $1.5 trillion each year from the top 40% of Americans to the bottom 60%. To close the income gap to zero would require $4 trillion. The questions to those who say we should do more to narrow the income gap are: Where on that continuum should we aim, and what policies would achieve these goals without bringing the economy to its knees?
Prices soar? How can that be when there was much too much of it just recently? Did you guys miss something?
• Natural Gas Soars as Report Shows Biggest Supply Drop in 7 Years (Bloomberg)
Natural gas futures jumped in New York after a government report showed the biggest February stockpile decline since 2007, as winter storms and frigid weather stoked heating demand across the eastern U.S. Gas gained as much as 5.7% after the Energy Information Administration said inventories tumbled 237 billion cubic feet to 1.686 trillion in the week ended Feb. 7. A storm is bringing heavy snow, sleet and ice from Virginia to Maine after cutting power to more than half a million customers across the South.
Surging demand has depleted U.S. gas stockpiles to the lowest level for the time of year since 2004 even as rising output from shale deposits pushes production to record levels. Gas output in 2014 may climb 2.2%, gaining for a ninth consecutive year. “We’re making some big digs into storage in this cold weather,” said Kent Bayazitoglu, an analyst at Gelber & Associates in Houston. “We have all this new production coming online but a lot of it has been hampered by the weather, especially when you have a severe blizzard coming through.”
Natural gas for March delivery rose 24.8 cents, or 5.1%, to $5.07 per million British thermal units at 12:09 p.m. on the New York Mercantile Exchange. Trading volume was 33% above the 100-day average. Prices are up 6.2% this week, heading for the first gain since the seven days ended Jan. 24. The futures have surged 20% this year.
More coal, more coal! Germany, US, they all do it. China first of all, but there, as we saw earlier this week, the entire coal industry is going bankrupt.
• Coal Burns Brighter as Utilities Switch From Natural Gas (Bloomberg)
Predictions of coal’s demise in the U.S. may be greatly exaggerated. Natural gas prices at a four-year high have utilities shifting to coal to generate 4.519 million megawatt-hours a day, the most since 2011, government data show. Within three years, coal’s share of power production could climb to 40.3% from about 39% last year, while gas’s share will probably drop to 27% from 27.5%, the U.S. Energy Information Administration said.
An arctic blast has helped put the U.S. on pace for the coldest winter in more than 30 years through January, prompting utilities to burn more of the less expensive coal. The U.S. is poised to emit the most carbon dioxide in three years, undermining President Barack Obama’s efforts to reduce pollution and steer utilities away from the fossil fuel.
“The idea of coal disappearing is not an effective climate change policy,” said John Thompson, an analyst at the Boston-based Clean Air Task Force. “Coal use is growing.” Thompson said implementing technology that allows utilities to capture carbon is better than trying to eliminate coal because other countries are increasing use of the fuel.[..]
Coal is the fastest growing energy source in the world, rising 2.3% a year through 2018, and poised to dethrone crude oil as the largest source by 2020, the International Energy Agency said in its December Medium-Term Coal Market Report. That’s being driven mostly by China, “where coal is powering an industrial revolution,” Laszlo Varro, head of the agency’s gas, coal and power markets, said in a Jan. 29 presentation at the Center for Strategic and International Studies in Washington. The fuel is also experiencing a resurgence in Europe as the continent’s economic woes increase its appetite for cheap electricity, he said.
The scary news keep right on a-comin’ from the Middle Kingdom.
• China Banks’ Bad Loans Reach Highest Level Since 2008 (Bloomberg)
Chinese banks’ bad loans increased for the ninth straight quarter to the highest level since the 2008 financial crisis, highlighting pressures on asset quality and profit growth as the world’s second-largest economy slows.
Non-performing loans rose by 28.5 billion yuan ($4.7 billion) in the last quarter of 2013 to 592.1 billion yuan, the highest since September 2008, the China Banking Regulatory Commission said in a statement on its website yesterday. Bad loans accounted for 1% of total lending, up from 0.97% three months earlier.
Chinese banks are struggling to keep soured loans in check and extend earnings growth as the slowing economy and government efforts to curb shadow financing make it harder for borrowers to repay debt. Standard & Poor’s Ratings Services said this week that loan quality will decline in 2014 as banks remain at risk from debt-laden local government financing vehicles and manufacturers with too much capacity.
“China’s economic growth turned downward with the new leadership switching policy focus to reform and risk management from emphasizing stable expansion,” said Wang Yichuan, a Wuhan-based analyst at Changjiang Securities Co. “Naturally the bad loans will increase along with the change. We expect the deterioration to continue for two more years.”
As I said: scary. What’s the US going to do when China falls on its face? Step on it?
• China Hard Landing War-Gamed for World Economy (Bloomberg)
A hard landing in China would hobble global growth and buoy the dollar, says Societe Generale SA in a study that war-games the international implications of a steep decline in China’s expansion. A plunge to 2% from more than 10% in 2010 would be enough to slash 1.5% from worldwide economic growth in the first year as China’s troubles are transmitted through trade, banking and financial market channels, the French bank said in a Feb. 11 report.
Among the reasons to expect such reverberations from what the authors called the “worst reasonable case:” China’s imports are equivalent to 30% of its gross domestic product. Asian and commodity-producing nations would be the hardest hit, according to Michala Marcussen, global head of economics research in London. The impact could be aggravated by China’s bias toward investment, which accounts for half of its GDP. Less worrisome is the risk of China hurting the world through banks, given that total foreign claims of banks on the country are just 3.2% of the total, according to data from the Bank for International Settlements cited in the report.
Some multinational companies would be hurt by their exposure and the dollar would also rise 10% against the yuan in the first year, according to Societe Generale. At the same time, a 30% drop in the price of oil as China slowed would aid growth elsewhere, as would an easing of monetary policy by foreign central banks, said Marcussen.
Chinese growth wouldn’t have to slow all the way to 2% to become a problem for developed markets, according to equity strategists at Credit Suisse Group AG in a Feb. 5 report. They say growth of 5% would be enough to start hurting, although they note such a slump is unlikely given that government debt of 80% of GDP gives China’s leaders scope to respond.
Worrisome elements include the third biggest bubble in private sector credit of recent decades and a real estate construction sector equivalent to 20% of GDP. Still, even if Chinese growth fades to 6% and U.S. expansion to 2%, the world could still grow almost 3% this year, they said. Societe Generale forecasts Chinese growth of less than 7% this year, below the 7.5% targeted by the government and anticipated by the International Monetary Fund.
“Nice” long list of UK major companies’ profit warnings.
• Recovery, what recovery? Spate of profit warnings shakes City (Guardian)
Debenhams kicked off the post-Christmas retail trading updates before the new year with a grim update on 31 December. In its second profit warning in less than a year the department store chain blamed unprecedented discounts on clothing for profits well short of expectations. Rivals accused Debenhams of starting the price war.
Mothercare issued a dire trading statement on 8 January, guiding analysts to halve their forecasts for full-year profit. The mums and baby retailer said Christmas trading had been hit by heavy discounting and poor sales of toys in the UK. Weakening economies and currencies in emerging markets also took their toll.
Morrisons was the biggest casualty of a tough Christmas for Britain’s big supermarkets. It was forced to announce on 9 January that like-for-like sales fell 5.6% over Christmas and new year as shoppers turned to German value chains Aldi and Lidl and the online and convenience store operations of its rivals.
Royal Dutch Shell shook investor confidence on 17 January when it said earnings in the fourth quarter would be about 70% down on the year before. The company suffered financial writedowns from dry wells and costs linked to its trouble-prone drilling programme off the coast of Alaska.
Central bank motto: “We don’t care. We don’t have to, because we own you.”
• New Central Bank Mottos (Mish)
Central bankers need new mottos. I happen to have a few proposals.
- It takes effort to fail, and we try harder.
- If at first you don’t succeed, repeat what doesn’t work.
- The 1% are our friends, and we hope it shows.
ECB Seriously Considering Negative Interest Rates
Appropriate mottos out of the way, let’s turn our attention to the silly idea of the day: negative interest rates.
Via translation from El Economista, please consider ECB Seriously Considering Negative Interest Rates.
Coeuré Benoit, a member of the European Central Bank government, said today that the ECB is ‘seriously’ considering negative interest rates.
Mario Draghi has repeatedly recognized that there is a debate within the ECB on the pros and cons of negative rates that would seek to force banks to lend.
Forcing capital impaired banks to lend is blatantly stupid. The expected result is higher losses. As a fundamental matter, it’s actually mathematically impossible to lend excess reserves. For discussion, please see Notes From Steve Keen on “Lending Reserves”
Regardless of the mathematical impossibility, people (even central bankers) want banks to lend their reserves to stave off deflation. The deflation-fighting idea is also ridiculous as noted in Deflation Theory Reality Check: Why Inflation is Severely Understated; Feel Good Effect
With the above in mind, additional motto suggestions are welcome.
Addendum:
I received a number of interesting mottos from readers. The best one was from Steve who proposes “We don’t care. We don’t have to, because we own you.”
Get used to it, Oz. Find shelter.
• Australia House Prices Set To Plummet By Up To 50% (Guardian)
If you are one of the many thousands of Australians at risk of being priced out of the property market, you had better wish that Harry Dent has got his sums right. Dent, an American investment guru who uses demographics to forecast economic cycles, thinks the soaring housing market is ready to burst any day now, perhaps reducing values by as much as 50% in some places.
Dent, who was in Sydney this week to promote his book The Demographic Cliff, has a formidable record. He claims credit for predicting Japan’s deflationary decade and the US boom and bust of the past 20 years, and has now turned his numbers on Australia. “I don’t see an upside in Australian real estate but there is a lot of downside. If you are going to own a house and live in it forever then perhaps it’s OK to buy a house, but speculative property – don’t do it.”
With housing valued at 10 times average incomes – the same level as California’s just before the subprime crash – Dent thinks Australia is heading for a fall which will be sparked by a sharp reversal of the current global economic recovery. “I see a decline in the 30-50% range across Australia, although it may vary from city to city,” he says. “The rule with bubbles is that they always go back to where the bubble started. So the US housing bubble started to grow in 2000 and now house prices have fallen back to that point – a 55% fall.”
He is supremely confident that it will also happen here. “Most people buying houses are aged between 28 and 41. When they can’t afford to buy a modest house for 800k as in Sydney, for example, then demand falls and real estate falls.”
While the many Australians with large mortgages might view Dent’s forecasts with alarm, he insists a crash would benefit the economy. “People should be praying that real estate will fall because it’s not good for living standards and it’s not good for the economy to have such high prices.’’
• Ron Paul launches clemency petition for Edward Snowden (RT)
Former Texas congressman Ron Paul has announced a petition aiming to secure clemency for Edward Snowden, the National Security Agency whistleblower who revealed extensive US surveillance programs and ignited a national debate on Americans’ privacy. In a video released Thursday on the Ron Paul Channel, an online network the libertarian started last summer, he calls on supporters to sign the petition in an attempt to bring Snowden home to the US safely before his temporary visa in Russia expires in July.
“Edward Snowden sacrificed his livelihood, citizenship, and freedom by exposing the disturbing scope of the NSA’s worldwide spying program,” he said. “Thanks to one man’s courageous actions, Americans know about the truly egregious ways their government is spying on them.”
Paul has repeatedly lent public support to Snowden since the former NSA contractor came forward to admit he leaked classified documents to journalists affiliated with the Guardian and the Washington Post.
“By signing this petition, you are telling the US government that Mr. Snowden deserves the right to come home without the fear of persecution or imprisonment,” the website stated.


This article addresses just one of the many issues discussed in Nicole Foss’ new video presentation, Facing the Future, co-presented with Laurence Boomert and available from the Automatic Earth Store. Get your copy now, be much better prepared for 2014, and support The Automatic Earth in the process!
Home › Forums › Debt Rattle Valentine’s 2014: Inequality Leads to War and Crisis