
davefairtex
Forum Replies Created
-
AuthorPosts
-
davefairtex
ParticipantChartistFriend –
I’m a big fan of specific, focused, helpful criticism that shows me how to better present information. Since you are a chart expert, I’m quite open to hearing what specific and focused criticisms you have about the charts I’ve created.
ParticipantStoneleigh –
I think another (unspoken here) requirement that is key to your scenario is a complete collapse of credit availability. If however the credit system remains more or less intact, bank depositors are bailed out FDIC-style but the bondholders are thrown under the bus and/or the banking system gets a massive injection of capital, credit will remain available and deflation will be more limited than you anticipate.
I think that outcome – the one where credit remains largely intact – is quite possible. The deflation will be bad, but not world-ending. Then again, I also believe your outcome is quite possible as well.
The scenario I presented in the article was the one I think that is almost guaranteed to occur – there is a very low likelihood avoiding that outcome given the situation I see today. In some sense, I’m saying: “I am virtually certain it will be at least this bad” based on the evidence I’ve collected.
Unfortunately I didn’t go to the next step and ask the question: “under what conditions could the outcome be substantially worse.”
It would be interesting to me to have a discussion about a set of trigger events that if they occur, would cause things to become dramatically worse. in other words, what would take the outcome in Spain from Ireland’s case (where things are bad, but haven’t collapsed because of that 140 billion they dropped on their banks) and push it into something substantially worse.
Ireland’s GDP stopped dropping as did their unemployment rate as soon as they resolved the uncertainty through the 143 billion euro money drop. This put a floor on the damage done. Spain didn’t do this, at least it hasn’t done this yet. If they do, will that arrest the economic collapse? Take a look at this unemployment chart:
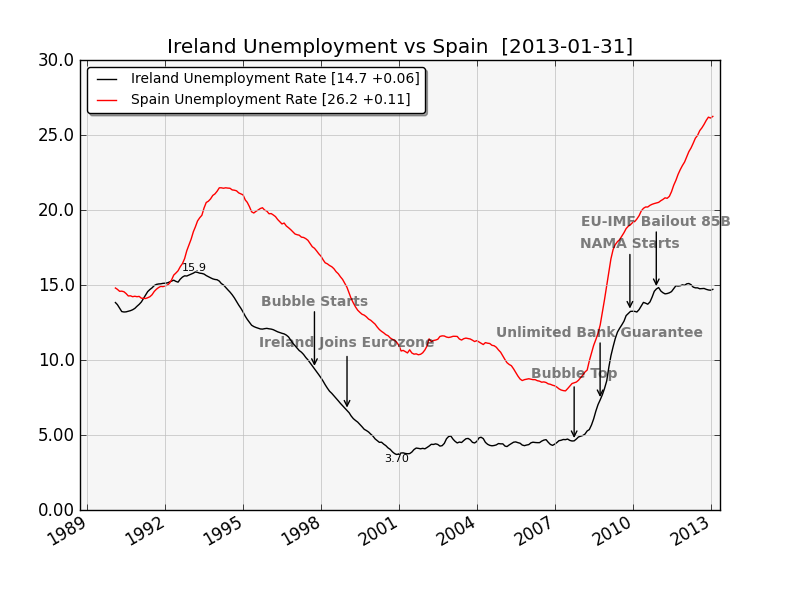
Ireland’s property bubble was at least as bad as Spain’s – likely worse based simply on the fact that 25% of their economy that was employed in the construction industry at the bubble’s height. Spain had “only” 15%.
ParticipantMark –
Great to hear from someone on the ground who actually owns property in Spain! I read about it, and use data provided by the Spanish government, but you actually are living it.
Corruption in Spain: since I don’t live there, I can’t judge for myself; I refer you to the Corruption Perceptions Index. Spain’s rating: 65, Ireland’s rating: 69. I was making this relative comparison only to make the case that Spain may well continue to overpay for bad loans more egregiously than the Irish – who also overpaid for their bad loans. This will make the bailout more expensive than it needs to be.
My sense is that property prices will continue to decline in Spain. I’m looking at this using overall country numbers, but real estate is always local so situations can vary a great deal. As skipbreakfast pointed out, there are probably homes built in what turn out to be pretty undesirable locations that are only revealed once the madness has ebbed.
I base my sense on the amount of bad bank loans that still need to be marked down. Given the size of the bubble, there hasn’t been enough “pop” in the banking industry. That’s because the banks have held properties off the market deliberately, to avoid taking losses that would end up bringing down the bank. Once all the bank rescue money is available, the sale of these properties will likely lower prices further. The only question is, how much further will that be?
If you are telling me that prices have already dropped to 2002 levels, that (paradoxically) makes me think my case is too optimistic, much as Ilargi has said. My gut feeling based on just how much unacknowledged deflation (unresolved nonperforming loans) is waiting on bank balance sheets says there is a lot of work still left to be done. Ireland’s prices have dropped back to 2000-2001 levels and it has plateaued for a year now. To get that to happen, they basically gifted 143 billion euros to their banking system in 2009-2010. Spain has done basically nothing – Spain spent 2009-2011 largely in regulatory denial; only in the last year has any progress been made.
I realize this is not what anyone who owns property in Spain wants to hear, but given Spain’s limited progress, and where you say prices are, is entirely possible that my scenario of the bubble pop stopping at 2002 prices is too optimistic.
Instead of saying how much further as a percentage property prices will drop (given the lies in the government statistics) I should use years instead. If you say prices are at 2002 levels now, given how much workout remains ahead, I’d say there are 3 scenarios:
1) 2000 (60%) – assuming a real resolution occurs in 2013 that successfully arrests the GDP drop and cleans up the bad debt in the banking system.
2) 1997 (30%) – assuming Rajoy takes his time negotiating with the ECB, people in power tell the truth slowly about the costs, all the while GDP continues dropping, and unemployment rises; full cleanup takes 3 years.
3) ???? (10%) – Spain leaves the eurozone, goes back to the Peseta, and prints money to solve the problem; possibly civil war or authoritarian government results in property prices becoming true bargains based largely on the Peseta’s 3:1 (?) exchange rate to the euro.Where will property prices will eventually end up? I think that depends on the scenario. At some point, when things become stable again in Spain, all the Spanish deposit money hiding outside the country will rush back in and buy up properties that have become true bargains. But that will await stability. Without stability in expectation, money will remain hidden.
Likewise, GDP and unemployment will likely not recover until a higher degree of certainty returns to Spain. Who in their right minds would take their savings (that is likely hiding out in Germany anyway) and start a business until this mess gets sorted out?
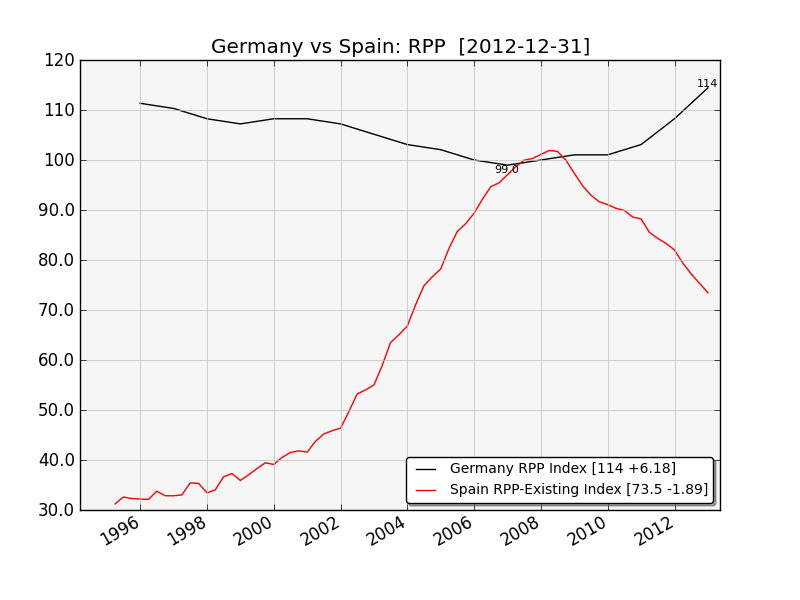
As for Germany, they didn’t have a property bubble. Perhaps their landesbanken are broke (I haven’t looked) but its not as a result of unsustainable property price growth. Here’s a comparison chart:
 Participant
One of the clear takeaways from the bubble pop in Spain, Ireland, and the US, is that most underwater homeowners continue to pay on their properties, if they can. The Central Bank of Ireland noted that 93% of their underwater homeowners were still making payments, even with the massive price drops. People have that emotional/irrational attachment to where they live. I believe that factor, more than anything else, will cushion the bottom with respect to residential real estate prices during this bubble pop.
You can see this in the deflation curves for the different sectors. Loans to homeowners are deflating slowly, while loans to corporations and banks are deflating rapidly. The latter dump their underwater mal-investments relatively quickly, while the former hold on for as long as they possibly can.
Ilargi said, “If Spain were to recognize the full 55% price drop, that would be the end of a large part of its banking system. And that in turn, for instance, would drive prices further down.”
That’s a possible outcome, but not a required outcome. By plowing in huge amounts of cash and taking the really bad assets off the hands of the bankers, Ireland appears to have effectively stopped that from happening, keeping its banking system afloat. Half of the rescue money in Ireland went to capital infusions directly into Ireland’s banks – their version of TARP. Their taxpayer saved their banking system (today it is mostly government-owned) and if current trends continue they will end up with a 55% drop in home prices.
If the US had done a TARP of a similar size, it would have been 6,352 billion dollars – ten times the size of the actual US TARP. And this is actual cash money dropped into the banks in Ireland. And there were no GM bailouts, no GE bailouts. Just the six banks. It was a very expensive operation.
Sweden executed a similar type of rescue (bad bank, capital infusions) in 1991, and they managed to avoid that outcome.
Perhaps most interestingly, during the 1929-1933 Depression, US home prices (when adjusted for in/deflation) actually were more or less flat. The only explanation for that is, the 20s weren’t caused by a housing bubble. But the point there is, even during a deflationary depression where cash was a scarce item and thousands of banks really did collapse, housing prices maintained their value in real terms. The last thing people want to lose is their home.
https://en.wikipedia.org/wiki/File:Case-Shiller_data_from_1890_to_2012.png
As Ilargi quoted me before, Houses are not Tulips. I should make a bumper sticker or something.
ParticipantStill pulling together the research on Spain. To give you a flavor:
Spain’s new Bad Bank (Banco Malo – actually named Sareb) has run off and bought 37 billion euros in bad debt; 66% are developer loans, 33% are foreclosed homes and property under construction. For these loans it paid 46% of face value – a discount of 54%. While a lot of articles I read suggest the loans are simply being “transferred”, what is happening is, the bad loans are in fact being SOLD, and the price averages 46 cents on the euro.
When sold, the selling bank must at that point crystallize losses, so after pretending for so long these loans are performing just fine and are worth 100 cents on the euro, now the selling banks must immediately write down these loans and take their losses so they are not super happy about that part. As for the prices they are getting – I’d say the level of joy should be relatively high, since Banco Malo is dramatically overpaying for these loans.
It may sound like a 54% discount is a good price, but all you have to know is that fully completed homes are selling on average right now for 53 cents on the euro to understand that overpayment is occurring. Should we imagine that raw land and half-finished houses should get only a 54% discount? Not bloody likely. NAMA, Ireland’s version of Banco Malo, having had 3 years of experience trying to sell the crap they picked up for 42 cents on the dollar, are getting on average 25 cents on their recoveries. And some of NAMA’s crap is only worth about 10 cents.
In all things like this, there are winners and losers. The Loser, in this case, is taxpayer-backed Banco Malo, which is paying 47 cents for an asset that might be worth 20 cents at best. The worst, most offensive, most underwater, hopeless, and nonperforming loans are being sold (oh I’m sorry, “transferred”) to Banco Malo. I wish there was another name I could give the bank – Banco Pathetico, perhaps, or maybe Banco Estupido, for paying 46 cents when it likely should be paying at most 20.
If the Spanish people realized that 37 billion of their euros were being basically handed over to their friendly bankers, they’d be more than slightly annoyed, I suspect. But somehow its all happened under the radar. Perhaps it is because of the neutral and obfuscatory language used in the articles describing what is happening. Who knows.
Anyhow, this is just a taste. Coming up with estimates for just how much has gone bad, how much has been written off, how much overpayment is occurring, and how much remains is complicated. Perhaps I can get it done this weekend.
ParticipantThis is really interesting to me – a great example of how price inflation happens differently in the different sectors. Its not a simple question of money creation or destruction, it requires a more complicated model than that. I think money creation plays a pretty big role, but the shortage of “new land” plays a part too. You can import cheaper food to lower costs, but the amount of land remains the same. Lastly, cheap energy was used to build the older houses, while building a new house is built under the current energy & resource cost structure.
Pop growth from 1971 until now: 12%.
So a combination: mortgage lending (likely much higher debt levels), pop growth, expensive energy, and no more land. Bananas and milk seem easier to manage costs for.
So many interesting problems, not enough time to model them all.
ParticipantGlad it worked out! Hopefully people will learn to follow the data regardless where it leads. That’s what I try and do.
I have another article I’m preparing analyzing the situation in Spain, with a more focused set of charts. I still need to do a bit more research but from what I see right now, Spain is pretty far from “hitting bottom.”
Not to spoil the surprise or anything.
I love the international flavor here. More perspectives can only help us figure out the truth.
ParticipantI quite agree there are definitely things you should probably not do, and one of them is earn money in one currency, and have a loan in another currency. Especially if the borrowed currency is one of those safe-haven currencies. Unless you really enjoy currency risk of course.
I think its possible for there to be conditions under which buying a house using a loan is a good idea. I’m certainly not going to so do, simply because the math doesn’t work out where I live, I abhor debt, and my income is not so dependable right now. But the math might work out better elsewhere, and I’m going to keep an open mind about such a possibility. Real Estate is always local.
I am more than passingly familiar with how rules differ around the world. I’m living right now in Asia, for instance. Even though I still write as an American and I still think of myself that way, I don’t currently live in North America. Where I am, the rules are most definitely more flexible, especially if you are well-connected.
ParticipantI’d venture to say that borrowing money from Vinnie the Kneecapper (or any of his close cousins) might easily fall under the heading of a “full recourse loan”, which was one of the things I suggested it might be wise to avoid!
I think we both read the same stuff.
One reason why I think its important to be clear about why certain prices are rising is that mis-assigning responsibility to a particular cause could lead one to make a bad policy decision.
For instance, if the political class thought that oil prices were rising for monetary reasons, they might consider tightening credit, which wouldn’t really help the situation if oil prices were actually rising because of scarcity and/or resource depletion.
ParticipantI say if you can buy a house for less than it costs to rent that same house, its a grand idea. Otherwise its just various versions of leveraged speculation which is a fine thing as long as you know that is what you are doing, you don’t anticipate major deflation, and you aren’t using a full recourse loan.
Steve Keen observed that banks these days don’t need reserves first in order to lend – step #1 is to get a willing borrower, and only then do they engage in step #2 where they run out and find the reserves to backstop the lending before the regulators get upset. The argument made sense to me.
In other words, more reserves won’t do squat to encourage lending because that is Just Not How Things Work. Credit growth isn’t happening because there aren’t enough willing borrowers, not because of some lack of reserves.
H&S pattern … looks like one, but as a practical matter, I’m gonna say it won’t function the same way, because its a % change y/o/y chart first of all, and second of all because those chart patterns are useful because of the fear/greed psychology of market participants interacting with various historical price levels and this is a derivative of the change in total credit which is kind of not the same thing. I don’t think regular people in the nation look at this month’s credit growth and either act to get a loan or not based on the net change!
However I do see a pattern of lower lows, and as trends go, it looks ugly. I predict things will go lower, absent any dramatic intervention. As they say, the trend is your friend, so go with the odds.
I read the Professor’s link, and it reminded me of those econ classes I took during my over-lengthy undergraduate career. Honestly it felt like I was listening to a pair of virgin psych grad students having a long and detailed discussion about sex. But that’s just my opinion, worth the paper its printed on, etc.
As I understand it, the deflation spiral happens after a bubble pop because both default AND repayment result in credit money being destroyed, which results in money becoming more scarce, which makes it more difficult systemically for others to get the money to repay their debts causing more defaults resulting in more credit money being destroyed. This continues until the overall debt level is reduced to a point where the debt level is sustainable for the incomes available to service that debt.
One of the very confusing things about this pop is that absolute prices of many things are rising. I believe resource constraints (declining ore grades, oil finds, etc) are a big reason why some prices are increasing. Government support of particular sectors is another reason. It is important to be clear about which prices are going up, which ones are going down, and why. But I believe that over time, the level of credit money in the economy will eventually have a strong influence in the general direction of prices, so that’s the thing to watch.
Participant@p01:
There is one instance of the word DEBT but it is hidden behind an abbreviation. D/GDP = “Debt/GDP”, Table, Header, column 4. Does that count?
It is interesting though. I mentioned credit a lot (lender/economic/systemic perspective) but not debt (borrower/individual perspective). I suppose that’s like talking about a fight where I discuss “punching”, but don’t focus so much on “getting hit.”
Participant@ilargi – yes got your mail, just slow in responding because I was asleep! (I’m in the ICT timezone right now)
@nassim – Thanks you are very kind!
@viscount – I picked two timeseries from the SDW. Their names are horrid, probably concocted by some economist or software engineer (!), so I renamed them. What does BSI even mean?
* “MFI.Loans.Total” = BSI.M.U2.N.A.A20.A.1.U2.0000.Z01.E; MFI Balance Sheets/Assets/Loans [monthly, euro area, all, outstanding at end of period (stocks)]
* “Bonds.Total” = SEC.M.U2.1000.F33000.N.1.Z01.E.Z; Securities Issues/Debt Securities/Outstanding amounts [monthly, euro area, all issuers, all securities]Note these two series are for the zone as a whole; these same series are available for each eurozone nation too, but change the “U2” to the country designator: “DE” for Germany. My intent was to cast as wide a net as possible for all credit everywhere.
MFI.Loans.Total is intended to account for all loans to anyone by any MFI and are listed on the MFI’s balance sheet. Any institution that can create money is called an MFI.
https://www.ecb.int/stats/money/mfi/general/html/index.en.html
MFI.Bonds.Total is intended to account for any debt security created by anyone anywhere in the eurozone, in any currency.
Here’s a link to SDW – the securities section so you can get a sense of the options: https://sdw.ecb.europa.eu/browse.do?node=17102
I’m still working on a way to describe my underlying data sources on my site in a concise yet transparent way, so if someone has a bone to pick with one of my charts, they can – and we can all get better data as a result. But it is a work in progress!
I’d appreciate any review you can give me. The goal is the truth!!
Hopefully someday it will set us all free.
Participantstoneleigh –
Well by now you know I love my charts. I’m happy to share. Discussions here have helped me greatly to refine the indicators I want to watch, and I’ve found that incredibly valuable.
I have learned through much experience (i.e. losses derived predominantly from my own stubbornness) not to trade based on my understanding of the macro situation – but only when the macro situation AND the price movements seem to align. That, keeping positions small enough for my own personal comfort level, and a stop placed so as to limit any potential losses just in case the trade goes against me – in case my timing is wrong. Which it is often enough to be annoying. I would encourage anyone else considering trading to do these three things.
But the trade is an afterthought. I felt this was a bit of a watershed moment, this move into actual deflation zone-wide as reported by ECB. If you look at Ireland’s MFI loan totals, and you see how much deleveraging their banks have done, and you look at Spain and see how relatively little they have done – well, it doesn’t bode well for Spain.
I remember when Ilargi said he felt the Spanish banks needed to write down some absurd amount (perhaps a trillion euro?) and I suggested that was too much. Now that I see the charts and what has happened in Ireland, I have to say he’s probably right. Perhaps not from a bad mortgage standpoint, but I’d bet there are a trillion overall in bad loans out there based on Spain’s MFI chart as well as that from Ireland. From the peak, a trillion euros gets Spain’s loan book back to about 2005.
And they have only written down a modest amount to date, perhaps 20%.
So either someone is gonna have to come up with 800 billion euros (!) to plug the hole or else…or else I dunno. The divergence clearly visible in the bond market – the rates Spain is paying – and the conditions appearing on the ground from a credit standpoint are really mind-boggling. As you say, when it snaps, it will be an impressive move.
My charts also let me monitor the eurozone credit spreads as well. That way I can continue to track the divergence – and I can also see the snap when it occurs.
ParticipantGolden Oxen –
Had a great conversation over at Chris Martenson’s site about hyperinflation. Came up with a bunch of metrics to detect it. Executive Summary: not happening right now, but size of monetization is getting closer to being worrisome.
Here are the indicators we came up with:
* monetization of at least 40% of US govt spending + increasing consumer confidence
* TIPs yield rising
* Loss of reserve currency status
* US Dollar dropping
* Money velocity increasingSee the page I constructed to show these indicators. Note that some of the timeseries on the page only update every 3 months, so they haven’t spotted the current monetization effort just yet. But you will get the idea.
* Monetization: was zero, now (about) 25% of spending
* Consumer Confidence: rising, but still low (below 2000-2008 levels)
* TIPS yield: at all-time lows
* USD as reserve currency: very slowly dropping, at 61% of global CB reserves
* USDX: moving sideways
* Money velocity: droppingParticipantFascinating observation. Structure drives conversation. The structure here is first Ilargi|Stoneleigh Post, then we discuss. There is no structure for a more free-form de novo contribution from the community which is then discussed and/or archived and organized later. It would probably need to be moderated and properly organized but that’s just detail.
Are we looking to construct a permanent collection of useful recipes? How-to for tons of different subjects? Collections of youtube videos on how to pluck chickens, make fire with a survival knife and paracord, etc? (So many things you can do with a knife and paracord – but I digress)
I think there’s a good opportunity out there for someone whose goal it is to come up with an education site with the aim of soliciting, vetting, and then organizing this sort of material into a quality collection.
Not sure if thats what the founders want to do here though. Its a big effort. Useful for sure.
ParticipantThe report is not the most straightforward, but in the end, the information is in there.
https://www.calpers.ca.gov/eip-docs/about/pubs/cafr-2012.pdf
Page 19, Section entitled “FINANCIAL OVERVIEW OF CalPERS FUNDS” has the summary bits, as best as I can determine:
Assets
245.8B Net Assets held in trust June 30, 2011
+12.4B total additions (contributions + investment gains or losses)
-16.8B total deductions (retirement, death, survivor benefits, expenses, etc)
-4.4B additions less deductions
241.4B Net Assets held in trust June 30, 2012One wonders why this isn’t spelled out more clearly, but given the poor performance, perhaps one doesn’t wonder after all.
Some interesting numbers I extracted:
average benefit: $28,323
administration cost: 0.8% ($231/member/year)In 2012:
15.4B to 543,722 retirees -> $28,323 per retiree
+3.6B contributions from 786,586 members
+7.8B from employersIt appears that they are running at a deficit of -4B per year.
Participant@Ken
My simple-minded view of things says, as long as the USG can spend its trillion per year of “extra cash” (i.e. 1T in treasury notes sold to the banks, and immediately recycled to the Fed who prints the money to buy them) neither the economy nor the stock market will drop appreciably. Deflation will be kept at bay.
That’s 30-40% of USG spending that is being borrowed each year, for anyone keeping score.
Attempts to reduce said spending and the Fed Chairman will start muttering darkly about Fiscal Cliffs again.
Risks to this simple-minded view is a precipitous european collapse. If the Spanish bad-debt chickens come home to roost even the extra trillion per year we print & spend might not be enough. However all is quiet over there, for now. See the spanish equity market rebound after the double-bottom in June/July 2012.
https://stockcharts.com/h-sc/ui?s=$ESDOW&p=W&b=5&g=0&id=p59882825599
ParticipantSurplus energy, trust, money & credit, population – and how they all interact in conditions of both expansion and contraction. Its a nicely constructed model of the world.
Population busts actually follow contractions – Russia, and Japan have both had them in recent years. If the world has a multidecade contraction, might we have many fewer babies than expected as a result?
Participant@backwards
I take it your pet theory involves Mysterious Manipulators. Ok. My pet theory is certainly no better than yours (all theories are equal in explaining the workings of a difficult-to-predict complex system) but based on my experience its one I give the highest chance of being correct.
The Cargo Cult folks believed in Cargo Gods. They were right – in a sense – but their painted rocks didn’t result in successful delivery of cargo, so we could say their theory was incomplete. Likewise, Mysterious Manipulators are those magical forces to which everything is attributed when things don’t go the way you expect, but this explanation is ultimately not helpful in predicting the way the market will go. At least, it hasn’t been to date.
Markets often function in what appear to be counterintuitive (magical) ways to people not so experienced in the ways of these things. Great earnings in a company can often lead to a fall in price. Terrible earnings lead to selloffs, and then immediate rebounds from which a rally forms. The announcement of QE3 led to an immediate stock market selloff. These are all explainable events – not using Mysterious Manipulators, but through market forces alone. But viewed from the outside, its frustrating, and thus magical (in a bad way) and it often doesn’t make sense.
A related issue that is very common problem with newer traders is the desire to “be right” whatever the cost, regardless of how badly a trade is going. This often leads to a big loss taken eventually (near the bottom, when the fatigue from loss is at an extreme point) rather than a small loss taken immediately. The newer trader will blame manipulators or bad luck, and double down (or more) in an attempt to “make back” the loss.
In trading, the desire (which we all feel) to “be right” is often fatal. Its far better to make money than be right. Doing that requires you to acknowledge when your trade is a losing one quickly, rather than endlessly sticking to your story (say about the market “being about to crash” throughout the entire 2009-2012 bull market) and pouring in more and more into a trade that clearly isn’t working out – and then blaming the whole thing on mysterious and invisible forces so as to preserve the ego.
An alternate approach is to look for more visible forces that could possibly explain the surprising 4-year bull market. That’s what I believe I’ve done.
Regarding injustice and the elites, I’m all for justice, and transparency. We should prosecute and convict every one of those bankers who committed mortgage fraud. The fact we haven’t is simply appalling. Corzine is just the latest perp that we’ve allowed to walk, and he stole a billion-six from his customers and gave it to JPM. Because he’s a bundler for Obama, he gets a free pass. Free markets require transparency in most things, and above all the rule of law. That failure of justice has been bipartisan, but I will dump a bigger chunk of the responsibility on the Republicans because I think they deserve it. Call it a 60/40 thing.
That said, this should not imply that the vast majority of market movement is to be explained by manipulators. Certainly intraday moves can happen based on trading trickery (anyone who follows the market has seen that) but over the longer time periods, the most effective and inexpensive manipulation happens in the minds of the participants through manufactured news releases and the resulting groupthink.
The true manipulation happens when the public is fed a series of news stories that get them to willingly take action – to leave the market in fear at the bottoms, and to buy in greed at the tops. One recent rumor after a sell-off in gold – “perhaps Paulson is selling his gold.” Bam, instant panic, even more selling, then a few days later once all the weak hands had been shaken out, a nice rebound.
But sometimes, markets repeatedly “break out” to new highs. Fund managers fear “missing out” on rallies and underperforming their averages, so they feel compelled to buy the breakout. Then buying pressure eventually subsides, fear comes back in, the market falls back, and the dip-buyers appear, providing support after a brief tumble. Rinse, repeat a few times, and you get a bull market.
That’s where we are right now. Am I recommending we buy stocks now? No. But in my world, the movements of this market can easily be explained over the longer term by money pouring into the economy through massive debt-funded government spending – there’s no need to have manipulators doing the heavy lifting when you get a trillion a year of new cash funneled through government directly into the hands of people. Our 2009-2012 bull market was funded indirectly through about 5 trillion borrowed and spent by the US Treasury. Not by Fed manipulation – at least not the direct kind where they buy stocks, anyway.
Occam’s Razor – the simplest explanation is more likely to be correct. We can all see the government spending and the low rates. Yet should we imagine that manipulators (whose behavior we can’t see) rather than the trillion PER YEAR of fresh money (that we can see) is the CAUSAL factor in our current bull market?
That explanation just smacks of painted rocks to me.
Manipulation does happen, but it doesn’t happen the way you think it does. In my experience anyway.
Participant@backwards
We all have our pet theories as to why the market doesn’t do what we expect it to. If we expect it to crash, and it doesn’t, its manipulation. Sure, maybe. But that is a lot of energy to expend just so we can prove that either we were right, or that but for Mysterious Intervention, we *would* have been right. The key being of course the very strong desire to feed our egos and “be right.”
My pet theory is very simple, and doesn’t require mysterious manipulation to explain the situation. The US economy has been growing based on ever-increasing debt levels for a long time now. This used to be primarily private sector focused, but now that the private sector is tapped out, its the public sector doing the heavy lifting, aided and abetted by the Fed’s total monetization of the public sector deficit.
As long as the public sector debt-funded “growth” continues, the market doesn’t require “manipulating” to keep going up. Its going up courtesy of all that debt-funded spending.
When the public sector spending stops, so will the growth. And then the market will tank, manipulation or no. It won’t be some inner cabal “shearing the sheep” (at least any more than normal), it will just be normal economic forces finally acting on an unsustainable system that finally ran out of lenders.
And of course every year that we take on more debt to keep the wolves at bay for just one more time, the more we will have to unwind when the debt funding stops.
Participant@p01 – Last Call for Credit!!
You are possibly right. Then again, maybe not.
We’ve gone through a whole lot of “top” calls during the past four years. I’ve been guilty of it as well. So I suppose yet another call for this being the REAL, FINAL top can’t hurt – that “last call for credit” and all – and if we keep on doing it ad infinitum, it will be correct eventually.
I’m trying a different technique. I prefer to watch my indicators and guide on what they’re telling me. At the moment – things continue pointing up, not down. Much as I imagine debt deflation should seize the world by the throat, it hasn’t happened. At least not yet.
ParticipantPeripheral bonds and the equity markets don’t share in the pessimism. As one might have expected, the combination of avoiding any semblance of fiscal responsibility in the US (while fully monetizing all new treasury issuance) and happy articles in bloomberg suggesting shrinking bond supplies in Europe has caused core euro bonds to drop, PIGS bonds to rise (italian 10 year now is yielding 4.3%), and the US equity market is set to open within striking distance of the cycle high.
I haven’t done a thorough analysis of the article above, but my guess is “falling” actually means “rising less rapidly than previously predicted” since very few nations in the eurozone have actual budget surpluses – and it would require real surpluses to shrink supply of bonds outstanding.
Still in all, I’m not one to poop all over someone else’s party (or stand in front of a speeding train) so – I’m predicting new cycle highs in the SPX.
Happy New Year everyone!!
December 21, 2012 at 10:00 am in reply to: Obama Has Once Last Chance To Become A Great President #6645ParticipantI understand the theory JW is trying to put forward, but I believe he’s wrong. A GAAP deficit doesn’t inject money into the economy. Only a CASH deficit does that. Why does that matter?
Inflation requires one of two things to happen:
1) money velocity increase
2) money supply increaseGAAP deficits don’t result in a money supply increase, nor does it cause a money velocity increase. They do represent the promises we’ve signed up for, but much like a parent who eternally promises the kids a trip to Disneyland, there’s no actual impact on the economy until that trip actually occurs. You could call a GAAP deficit “latent inflation”.
CASH deficits on the other hand DO result in a money supply increase, and that causes inflation today. That’s because money is spent by the government directly into the economy – on social security payments, weapons systems, salaries, SNAP programs, medicare reimbursements, etc, where that new money competes for goods & services with all the existing money.
So CASH deficits are immediately inflationary, while GAAP deficits are promises of inflation yet to happen.
I believe JW correctly summarizes the promises we’ve made as a nation. We can debate whether or not we believe the promises will be kept, but any inflationary ACTION must await the moment when we as a nation have to make good on those promises. At that moment, we will have a CASH deficit in order to fund them, and that is when the money will be injected into the economy and create the inflationary effect.
We can all guess what the probability of the US being able to make good on its promises – its vanishingly small.
Will the default on those promises be explicit (sorry grandma, off the cliff you go) or implicit (inflation numbers fudged + benefits paid with monetized CASH deficits)? I have no idea. Likely a combination of both.
The Fed is currently monetizing 100% of our current cash deficit. If this continues in perpetuity, then JW’s inflation scenario will play out. But there are limiting factors in play here too. For instance, will oil exporters continue to export oil to us in perpetuity while we do this? With oil gradually becoming more scarce?
My guess is, they’ll yank our credit before hyperinflation from monetizing the CASH deficit arrives – but who really knows.
Participantjal –
I was not making a comment on the morality of the move or the intervention or who benefits, I am simply observing what seems to be happening. I’m guessing that another market high is likely to occur – like a weather forecaster who looks at clouds and pressure zones and predicts “80% chance of rain tomorrow.”
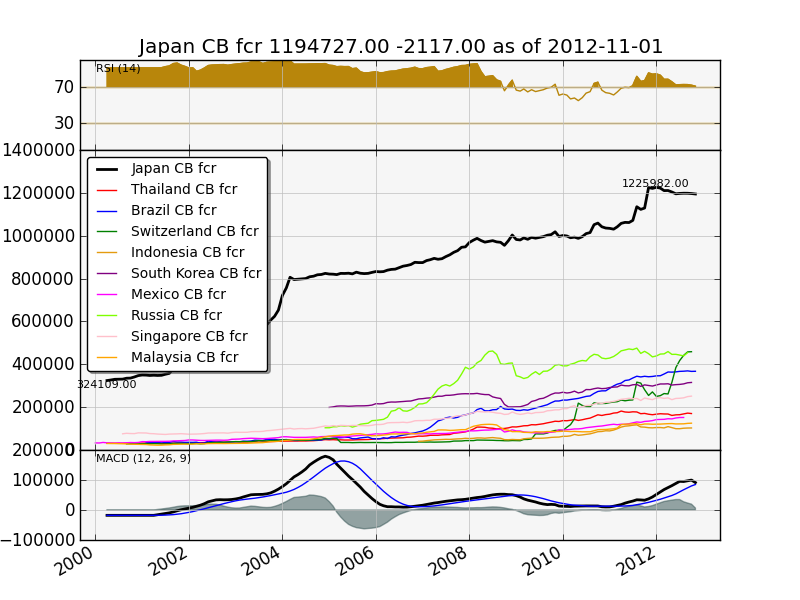
Its not only the US and ECB that are printing. Here’s a chart of the foreign currency reserves of the various exporting nations. To keep their currencies from appreciating (and their people employed) they print their own currency and buy dollars and euros.
 Participant
Based on what I see right now, I think it is probable that the SPX will make a new high either by the end of this year or early 2013.
The relief stemming from the probable fiscal cliff fix coupled with some good news from the european bond markets driving the euro higher and the Fed signing up to effectively monetize ALL US Treasury debt issuance going forward “until things improve” should really help US equities.
I’m seeing more money moving out of the safe havens now and into the PIGS bonds and the equity market. Spain had a decent bond auction today, although they were all short term bonds which are seen as low risk.
ParticipantAll of scandinavia (Norway, Sweden, Finland) look pretty good from a government debt and budget balance standpoint. They’re all either in balance or have a surplus, and their debt/GDP stands at 44%, 38%, and 49% respectively. Their bonds are trading in that “safe haven” area where the 10 year is yielding in the 1.5-2.2% range.
Switzerland has been successful to date keeping their currency appreciation in check by printing money (and buying euros, mostly) whenever the Swiss Franc looked like it was getting too high. However this has left Switzerland with about 70% of GDP (about $450 billion) in currency reserves. This trade will look brilliant if the eurozone lives, and it won’t look nearly so good if the eurozone breaks up.
If Nicole’s predictions come true and things really come unglued, it will be difficult for places like Scandinavia and Switzerland to keep a lid on currency appreciation. There is a LOT of money out there and these currencies are small. Without controls, this will seriously distort their markets. Even now with all the money printing and the eurozone rescues the Swiss 2 year is yielding -.23% per year.
The choices for the safe haven countries whose economies are small (Scandinavia, Switzerland) and who live outside the eurozone is either money printing or capital controls. Or perhaps both. I don’t imagine they’ll just sit by and let their currencies get wanged around by safe haven flights without trying to do something.
Participant@nicole
The bond rate graph did show an astonishingly small interest rate differential between Greece and Germany during the salad days of the euro, that’s for certain. And it did a great job showing “before”, “during”, and “after”. The objection I had was only on the issue of trend analysis.
Which brings me to that question: where are things going next? Will spreads ultimately narrow, or will they widen further? The most current data shows that the pressure has come off substantially. Will that pressure relief continue, or not, that’s the primary question.
Ok, I ran off and did some analysis.
Here’s the thing. The ECB knows that this 10 year bond chart is what traders are watching like the entrail-reading Romans of old trying to divine the future of the zone. Looking at my new data for the entire zone, I see is that pressure has indeed come off the PIGS, quite dramatically, but money has not left the safe haven countries at all. In fact, all bonds everywhere have had their yields go down since mid-2012.
This is a curious pattern. One would expect if there was genuine relaxation and return to risk-taking in the peripheral nations, money would have moved OUT of the safe havens. But that’s not what went on. Money has continued to pour into french and german long term bonds. That’s the curious thing.
I’m tempted to put the blame on central bank buying. But I have no actual evidence, so I’ll continue to poke around and see what comes up.
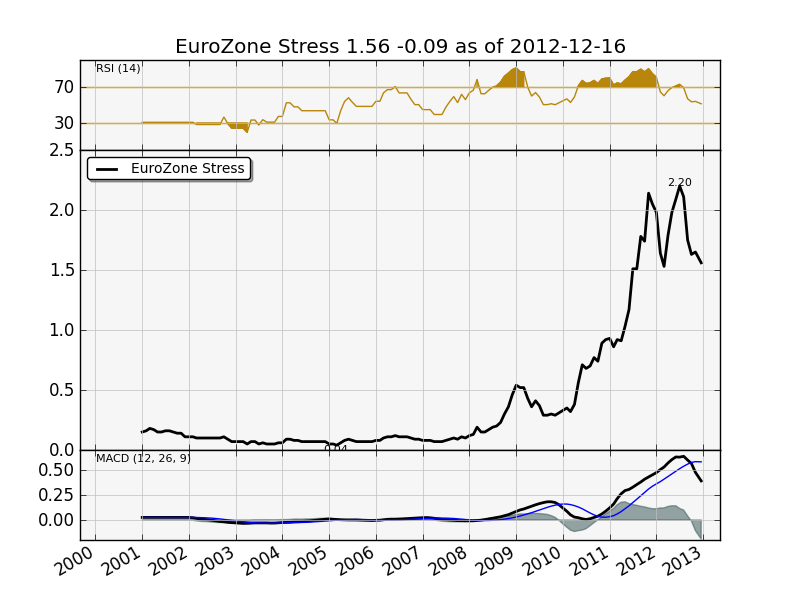
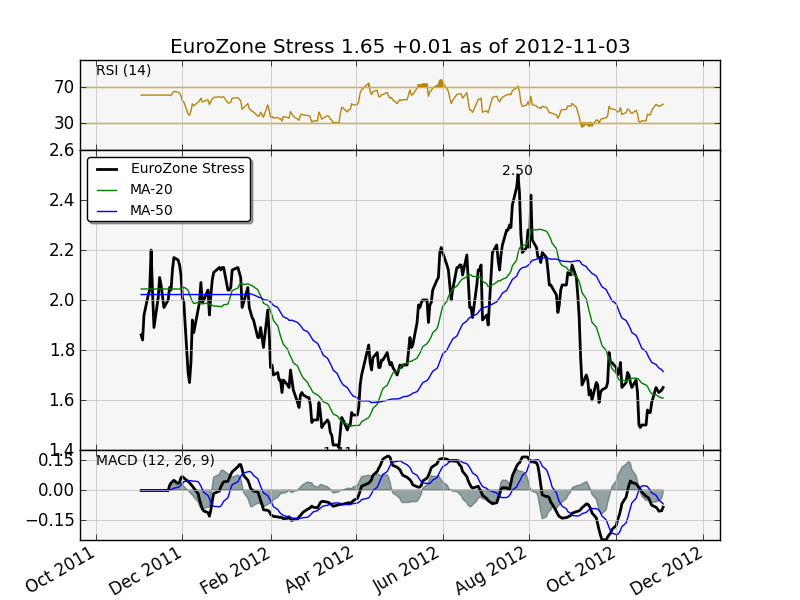
ParticipantHere’s my eurozone stress chart using the new monthly data. Again, this is the average debt-weighted spread – when German yields drop, and/or when PIGS yields rise, this causes a rise in the spread. And because it is debt-weighted, a move in Italian rates by 10 basis points will cause the chart to jump more than a move in Spanish rates by 10 basis points since Italy has a lot more debt than Spain.
I’ve eliminated Greece (since they defaulted) from the calculation, so the latest dramatic move down in Greek debt won’t affect the chart.
I don’t have a point to make here – this is more of a “submitted for your approval” sort of post.
 Participant
Ok so it turned out not to be all that hard after all. Data is available (for those few who might care) at the ECB website, https://sdw.ecb.europa.eu.
Thanks to Nassim for prodding me into getting the data.
Notice how Ireland started improving months before the other PIGS; also notice the data is a month behind where we are now. Greece 10Y bonds are now yielding 13%, thanks to the buyback program.
This is Nicole’s updated chart:
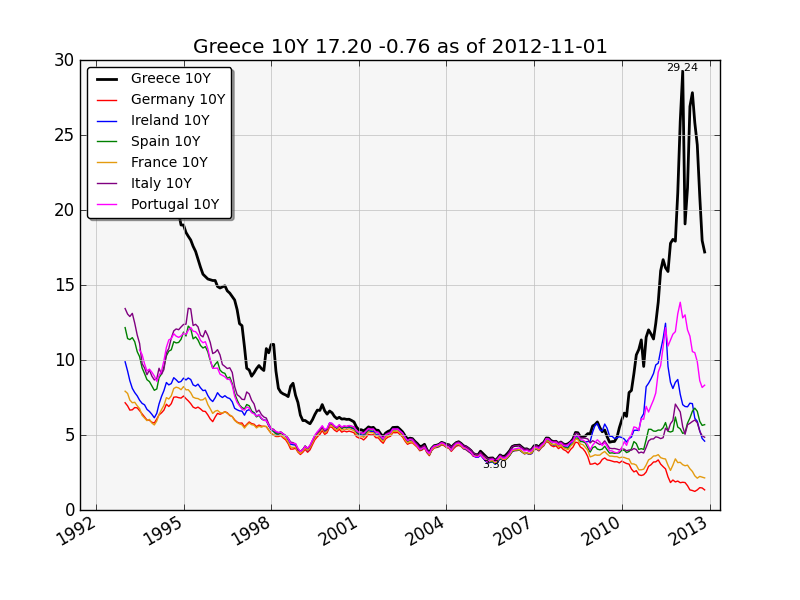
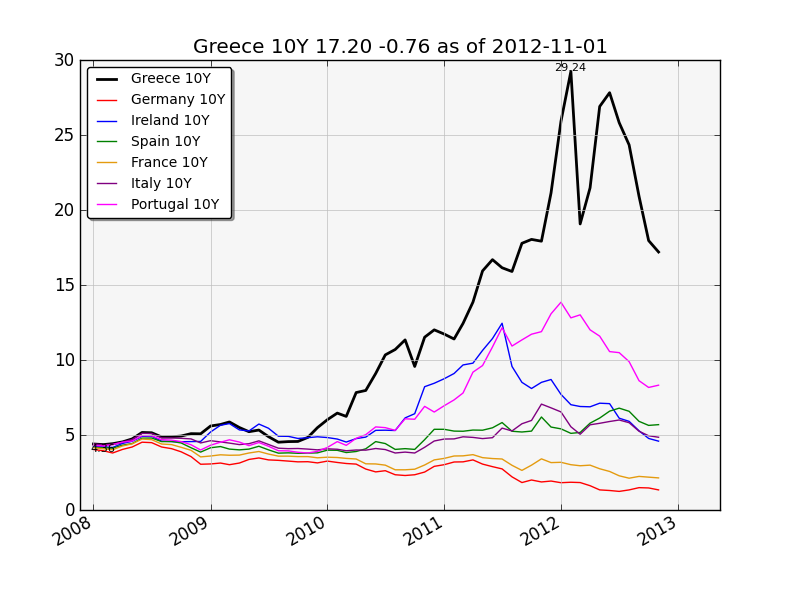
And same chart starting in 2008, for better recent detail:
 Participant
You are of course correct, its not 36 months at all – looks more like 14 or 15. I plead a basic math failure.
However, a whole lot of dramatic stuff happened between mid 2011 and now, so my basic point still holds I think. If we saw the chart updated today, it would paint quite a different picture. Ireland specifically would look a LOT different, and one might make the case that if the trends currently in place continue to improve, that “things are getting better” and possibly even that “austerity works” – at least in the case of Ireland.
I’m certainly NOT trying to make that case, and I agree with most of what she’s said, I’m just making the point that the evidence provided is missing some really important recent events, and I’m all about proper evidence since it helps me to remove my ego and opinion from the analysis.
I have a summary chart on bond spreads that weights bond yields based on the amount of debt each nation has outstanding, and it shows that things have come down quite a bit (narrowed in aggregate perhaps 25%) since nov of 2011 – and also that things got quite a bit worse than Nicole’s chart shows during mid 2012. Unfortunately my data only goes back to late 2011, so (@Nassim) I can’t provide you the charts.
If anyone can point me at a time series source that has 20 years of 10 year bond rates for the countries in question, I’d be more than happy to provide that chart. I just don’t have the access to the data myself, and I’m too cheap to fork over the $$$ to buy it! I’ll poke around a bit and see what I can find.
ParticipantI think contrary indicators like NR capitulating and calling a housing recovery is good, but in my experience they don’t typically call the top with any reliable accuracy in terms of timeframe. Perhaps we need a Time Magazine cover for that. Uh, does Time still actually publish a hardcopy magazine?
I think the housing recovery stops when the US government has to engage in actual austerity (i.e. it is forced to stop its trillion-plus deficit-spend every year). The Fed is now monetizing 100% of all new treasury issuance. These combined policies (deficits + monetization) are keeping things afloat, at least for now. And I think that ability to monetize with impunity will likely continue until Europe comes to some sort of resolution. Just my opinion.
@Nicole
I agree with the tone of your post; just one nit to pick. The chart showing 10-year rates is hopelessly dated – perhaps 36 months old at this point. Greek rates hit 24%, then backed off to 13%, Ireland is at 4.7% not 10.5%, and Portugal is at 7% not 10.5%. Italy and Spain yields have dropped also. Overall, in terms of bond spreads, things have definitely improved – and in some instances, quite dramatically. Ireland from the point of view of bond spreads could be the poster child for a successful austerity program, with its rates on a par with Italy.
Bond spreads matter a great deal to market observers. And in terms of seeing where we are (and making a claim to increasing pressure), well, in my opinion the chart you used just isn’t indicative of the current reality.
ParticipantIlargi –
I agree with all the stuff you say. I’ll add:
As long as the US government can successfully borrow 30% of federal expenditures every year, I think that things will remain largely happy. Our housing prices bounce, we see a modest recovery, and all will seem well.
Its only when we can no longer live on prosperity borrowed from the future that the whole ponzi system will unwind – the way it is doing right now in Spain and Greece. So that market crash that some people expect won’t happen until that inability to borrow comes home to the US government. Inability to borrow happens first in the periphery and then moves to the core. And the US defines “the core”, so it will happen here last.
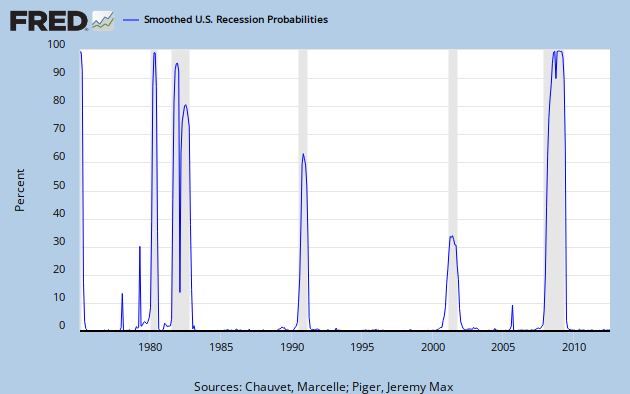
Regarding recoveries though – an interesting chart crossed my screen the other day. An indicator which seemed to do a good job at predicting recessions. Here’s the chart:
https://research.stlouisfed.org/fredgraph.png?g=dht
I make no claims on its ability to prognosticate, but it did intrigue me. This indicator doesn’t trigger too often, and in the past 40 years it has never gone above 20% without a recession happening very soon thereafter. My trader instinct says to wait for it to hit 30-40% before taking action, because these are unusual times. This indicator is updated monthly. However, I have not done a deep dive into understanding what goes into calculating this index. Here’s the paper behind the calculations, in case YOU want to dive into this particular rabbit hole:
https://research.stlouisfed.org/publications/review/03/03/ChauvetPiger.pdf
Having an indicator that can detect the onset of a recession in real time is actually quite valuable – at least for those of us who are interested in such things anyway. Usually, we only find out we entered a recession six months after the fact.
Will a recession cause a market crash? An interesting question. It would surprise me, given all the money being borrowed and spent. But it could happen. Currently, I’m on the fence.
ParticipantOptimism, pessimism, fatalism – all interesting words.
Sometimes it seems like – and I’m paraphrasing JMG here – the only two permissible thought-states in this TSHTF dialog are self-deluded hopeful optimism and well-informed apocalyptic fatalism. I’d like to find another state, if possible. I’d like to retain my pro-survival health-inducing positive and hopeful attitude, while not letting that stop me from taking steps to limit downside risk and expecting trouble coming on the horizon. I don’t find that particularly easy.
That Prison of Debt Paralyzes West article – a good big picture look at where the western world really is; government, debt, prosperity, expectation, and economics. Thanks for the link.
It is clear that the reason for the downward spiral in Spain & Greece is that prosperity in both places was debt-funded illusion, and that they are the canaries in our global coal mine. How will our unwind take place, and what will it look like? When will our illusory prosperity vanish, how will we handle it, and how will that impact government and our collective mental state?
We do not have control over events, but we can control how we react to them. In fact, that’s really the only control most of us have over our existence here on earth. Remaining personally hopeful and positive – I won’t use the word optimistic – is my goal. For me, remaining in a negative mental state is unhealthy and thus anti-survival. That seems like a bad idea overall, even if it might provide more motivation to prepare.
This is a really good discussion I think, at least for me.
ParticipantI believe in the optimism bias for sure. I would claim that optimism is a valuable survival trait. The optimists continue putting in effort in spite of what looks like (and what may in fact be) certain doom. The pessimists just curl up to die. After all, why bother to expend energy when there is just no point?
Yet as Ilargi pointed out, the folks in charge have taken advantage of this built-in bias to provide cover for financing a state-led bailout of the German & French banks (i.e. the “Greek Bailout Plan”). The super-corrupt elites in Greece go along, because this lets them continue to feed at the trough for a little while longer – meanwhile they ship their valuables overseas because they know this cannot last, while cutting the “surplus” available to the society at large as ordered by the IMF/EU. And euro society buys this because they, like Fox Mulder, want to believe because of the built in optimism bias.
It is a tough call. We need to maintain our optimism through these times because a positive attitude is critical to maintaining both motivation and good health, and at the same time remain clear-eyed in order to see through the lies embedded in unsustainable policies. How does one do this without turning pessimist/fatalist? That’s the trick, isn’t it?
November 4, 2012 at 12:23 pm in reply to: Europe Makes Obama Look Good, But That's Not The Whole Story #6292Participantprofessor –
The whole “break everything in sight and then repair it” plan requires a whole lot of surplus energy – a fair amount for the breakage, and then a whole lot more for the repair. Given where we are in the net energy/debt situation, we might well get the breakage and then find ourselves in the unfortunate situation of being unable to afford the repair.
November 3, 2012 at 3:05 pm in reply to: Europe Makes Obama Look Good, But That's Not The Whole Story #6286ParticipantToo many things to agree with in the article to comment on. So I’ll just add some stuff of my own to it.
According to fivethirtyeight (which has an impressive set of charts and a computerized model behind them, always something to gladden my heart) Obama has an 83% chance of winning. That first debate caused troubles, but he’s recovered since then. The guy behind the blog (Nate Silver) apparently made his bones successfully predicting outcomes in 2008.
His deal is looking at state-by-state polls alongside overall state tendencies and folding them together with electoral college math.
https://fivethirtyeight.blogs.nytimes.com/
The US looks good because we’re still able to borrow & spend 1.3 trillion annually. Looking at the Fed Z1 its easy to see – even though the rate of total credit growth has slowed, we’ve still added a cool 5 trillion of net credit money since 2008, if you exclude the domestic financial sector deleveraging. My opinion: this is not a sustainable practice, but bond yields are under control at the moment. It all works until it doesn’t, as they say.
I can’t find similar data for Spain, but just based on their government debt growth, they’re likely deflating. I’d bet their private debt growth numbers are terrible. I just wish I had the data to chart.
My eurozone bond market stress indicator has started to nose upwards again. I’m not willing to call a trend change yet back towards crisis, but its getting there – in tandem with some recent short term US dollar strength, its possible the recent two month euro honeymoon may be coming to an end.
Such interesting timing to have this happy euro quiet period immediately prior to the US election. It will be interesting to see what cuts loose after Nov 6.
 Participant
SteveB –
Dave, you seem to be projecting the present into the future. Ilargi’s question might have been seen as a reminder that that’s a futile exercise.
I’m glad you understand what his question might have been about. I certainly didn’t. It seemed to me to be a non-sequitur, or a derailing technique.
I prefer things to be more clear and direct. If there’s a point to be made – for heaven’s sake, just make the point.
Participantillargi –
Then why are all those companies, GE, Siemens etc., closing their solar divisions?
I’m sorry, did I miss your factual response to what I said, which was that rooftop solar seems to have a payback period now of about 10-12 years?
Likely the payback period (without incentives) is not attractive if you aren’t paying normal residential rates, but at that rate, assuming an annual built-in rate increase, and given Mom is in San Diego, it really does work. It pencils out even more attractively if you try to look for other investments that can get you a guaranteed 5% ROI on invested capital while capping your power bill inflation risk, and you end up not finding any.
Aha. I found a paper backing me up, from bloomberg new energy finance:
http://www.bnef.com/WhitePapers/download/82
As of April 2012, the factory-gate selling price (ex-VAT) of modules from ‘bankable’ or “tier 1” manufacturers was $0.85/W for Chinese multicrystalline silicon modules, $1.01/W for non-Chinese monocrystalline silicon modules, with thin film modules and those from …
And on an installed, fully loaded basis assuming 6% financing:
The LCOE for PV c-Si has declined by nearly 50% from an average of $0.32/kWh early 2009 to $0.17/kWh early 2012, while that for PV thin film experienced a drop from $0.23/kWh to $0.16/kWh in the same period. According to BNEF, the current (Q1, 2012) levelized cost ranges from $0.11/kWh to $0.25/kWh
And even at those prices, First Solar is still making money. Just not as much as they did before.
Naturally, location matters a great deal. San Diego is a much better candidate than Frankfurt.
But I stand by what I said before. Rooftop solar, even unsubsidized, is starting to look attractive – depending on location, especially in the low interest rate environment.
And in three years? I think it will be an even clearer win by then.
ParticipantI enjoyed the article. I especially liked the terminology of energy inheritance and energy income.
Unsubsidized rooftop solar right now seems like it has a reasonable payback period at about 12 years, with expected equipment lifespan of 20-25 years. However the concept of living a powered life only while the sun is shining is going to be quite the adjustment to make if we don’t find some good storage technology pretty soon.
And its important to ask just how much oil goes into making each solar panel. Until the solar factory (and all the suppliers) are run by solar power…all we have is an oil-to-solar-electricity converter at a certain conversion rate.
The holy grail has always been some local low-cost storage technology (my favorite are PEM stack hydrogen) that allows us all to timeshift the power use (with some hopefully low loss rate), unfortunately its all just too expensive right now.
All those issues with grid management really says to me how critical it is to keep power solutions as local as possible.
October 27, 2012 at 1:45 am in reply to: Japan Is Not A Good Example Of How Deflation Typically Plays Out #6161ParticipantRandom chart I’m working on:
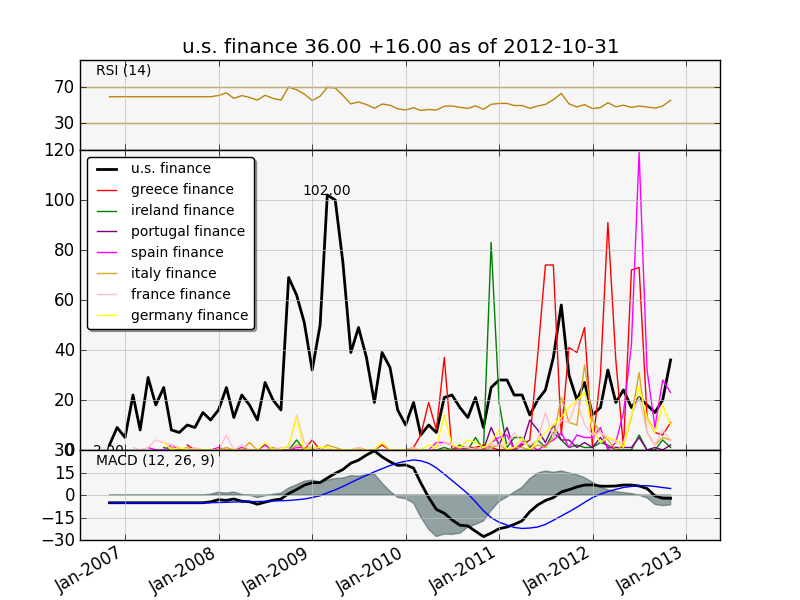
This is a chart of finance-related headlines since late 2006, aggregated by nation, counted on a monthly basis. Its a pretty simple concept, but I think it is interesting to see how the newsflow moves from nation to nation. Is the rough number of finance-related headlines indicative of the level of crisis in the nation? Or just the amount of breathlessness the press brings to bear upon the issue?
I don’t know. Its just data I collected. Submitted for…your enjoyment.
-
AuthorPosts