
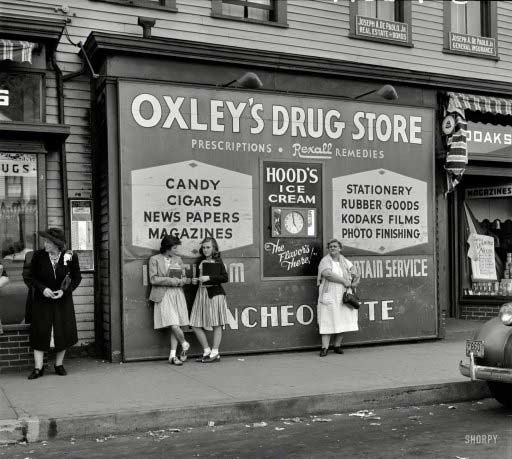
Fenno Jacobs for OWI “Southington, Connecticut. Girls at drugstore” May 1942
The story of the day should perhaps really be the 26+ killed and 1000+ wounded in Ukraine, where the violence shows no sign of abating, and another deadly night could be in store. Or, you know, Kazachstan or Thailand or Venezuela. The pattern is familiar: thugs mingle with students grandma’s and peaceful complaints either get entirely discredited or create total confusion. But from as far away as I am, and most of you, it’s impossible to get a real grip on Kyiv’s Independence Square right now, and besides the numbers coming from the US are bad enough that they warrant some scrutiny.
The Census Bureau just announced data that pretty much make a complete joke of the idea of a housing recovery. And no, the weather is not a joke, but its influence is grossly overstated by those who are interested in overstating it. Be that as it may, housing starts plunged 16% month over month to an annualized pace of 880,000, and building permits fell 5.4% to 937,000. Interestingly, certainly when the weather is included, January housing starts were up in the Northeast, by no less than 61.9%, and down everywhere else, even -67.7% in the Midwest.
Yesterday’s Homebuilder’s Index gave an early warning of these numbers, as per CNBC:
Sentiment among the nation’s home builders fell dramatically in February, and while builders blame much of it on the weather, that is not the whole picture. Confidence fell 10 points, according to the National Association of Home Builders’ monthly sentiment index, from 56 to 46 – the largest drop in the history of the survey, which started in 1985. 50 is the line between positive and negative sentiment.
While it has been popular to blame much of the slowdown in the winter housing market on colder-than-average temperatures and higher-than-average precipitation, [..] “Last month was cold, but it wasn’t the coldest January of the Millennium,” noted Jed Kolko, chief economist at Trulia.com.
While Lance Roberts at STA saw this coming from a mile away:
The Total Housing Activity Index is an index of all economically important housing activities from new and existing home sales, to permits and starts:

The optimism over the housing recovery has gotten well ahead of the underlying fundamentals. While the belief is that the current push in housing is a side-effect of a recovering economy, the reality may be a function of the speculative rush into buying rental properties for cash which created a temporary, and artificial, inventory suppression.
The housing plunge seems to have a double faced connection with household debt. On the one hand, borrowing, including for homes, has gone up. But on the other hand, obviously, Americans are already so deep in debt that buying a home is either completely out of reach, or risks bringing the hand of doom upon the buyer. Bloomberg:
Consumer debt in the U.S. rose last quarter by the most in more than six years as Americans borrowed to buy homes and cars and to pay for education, according to a survey by the Federal Reserve Bank of New York. Household debt increased 2.1%, or $241 billion, to $11.52 trillion, the biggest gain since the third quarter of 2007 …
The craziest part of US debt, rising fast, is student debt. America is busy destroying the future of the majority of its children, and no-one will pay attention until that’s a done deal. Americans have insane levels of credit card debt, no doubt about it, but student debt will be twice that sometime soon. Tyler Durden:
… as of December 31, the total amount of non-dischargeable (for now) student loans hit a new all time high of $1.08 trillion an increase of $53 billion in the quarter. By comparison, total credit card debt as of the same period was “only” $683 billion. At this rate, total student loans will be double the size of all credit card debt within 2-3 years.
… the amount of heavily delinquent student loans has just hit a fresh record high of $124.3 billion, up from $121.5 billion in the prior quarter.
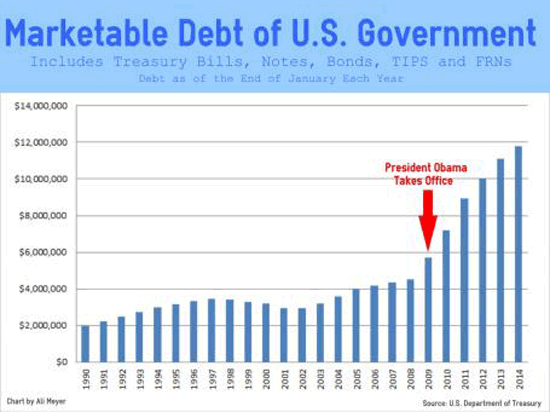
More debt, and why not: US marketable debt has doubled under Obama, though you need to ask yourself if he should be blamed for it, let’s just say it doubled in the past 5 years. Which is fine – or bearable – for the moment only because interest rates have been artificially suppressed. When the Fed loses control of those rates, it’ll neither be fine nor bearable. Numbers from CNS:
The marketable debt of the U.S. government has more than doubled – climbing by 106% – while President Barack Obama has been in office, increasing from $5,749,916,000,000 at the end of January 2009 to $11,825,322,000,000 at the end of January 2014, according to the U.S. Treasury’s latest Monthly Statement of the Public Debt.
In January 2014, according to the Treasury, the U.S. paid an average interest rate of only 1.998% on its marketable debt. In January 2009, when Obama took office, the Treasury was paying an average interest rate of 3.116%; and, in January 2001, when President George W. Bush took office, the Treasury was paying an average interest rate of 6.620%. That means that the average interest rate on the U.S. government’s marketable debt is currently less than a third of what it was in 2001—when the U.S. had only $2,977,328,000,000 in marketable debt, or about 25% of the marketable debt it has now.
So where is that marketable debt being held? Funnily enough, the two largest holders, China and Japan, have been selling, but overall holdings of Treasurys by foreigners are up. AP:
Foreign buyers of U.S. Treasury securities increased their holdings to a record in December even though the two largest holders of U.S. government debt — China and Japan — reduced their shares. The Treasury Department says total foreign holdings rose 1.4% in December to $5.79 trillion, surpassing the old record set in March of $5.73 trillion.
China, the largest foreign buyer of Treasury debt, reduced its holdings to $1.27 trillion in December. That marked a 3.6% drop from China’s November level of $1.32 trillion, a record for that country. Japan, the second-largest buyer, trimmed its holdings to $1.18 trillion in December. That was down 0.3% from November’s total.
However, as Tyler Durden notices, not all US Securities are Treasurys, and all the rest is being sold. Or, you could say, swapped for Treasurys. A flight for safety in the securities markets.
… while the two largest US foreign creditors were net sellers, total foreign bond holdings actually rose in the last month of 2013 and as the chart below confirms, when it comes to Long-Term Treasury paper, foreigners were actually buyers of some $18 billion in Treasurys. It is everything else that they sold in the month when the S&P hit its all time high: specifically, foreigners were net sellers of Agency securities ($15.4 billion), Corporate Bonds ($7.5 billion) and Corporate Equities ($13.7 billion).

The chart is very disturbing: it shows that as the S&P rises higher and higher (on ever declining volumes), foreigners are buying fewer and fewer US securities. In fact, on a 12 Month Moving Average basis, foreigners bought less long-term US securities than they did when Lehman crashed!
Luckily we live in a New Normal when price is no longer determined by simple supply and demand (and certainly not from retail investors who have long since given up on the fraudulent, broken US capital “markets”) but Fed jawboning of a record $2.5 trillion in bank excess reserves, corporate buybacks and HFT algos spurring momentum ignition and buying because others are buying.
China sold more Treasurys then it ever has, with the exception of December 2011. But not to worry, there’s another world power waiting in the wings to pick up the slack:
Chinese Treasury holdings plunged by the most in two years, after China offloaded some $48 billion in paper, bringing its total to only $1268.9 billion, down from $1316.7 billion, and back to a level last seen in March 2013!
… what was truly surprising is that despite the plunge in Chinese holdings, and Japanese holdings which also dropped by $4 billion in December, is that total foreign holdings of US Treasurys increased in December, from $5716.9 billion to 5794.9 billion. Why? Because of this country. Guess which one it is without looking at legend.

That’s right: at a time when America’s two largest foreign creditors, China and Japan, went on a buyers strike, the entity that came to the US rescue was Belgium, which as most know is simply another name for… Europe: the continent that has just a modest amount of its own excess debt to worry about. One wonders what favors were (and are) being exchanged behind the scenes in order to preserve the semblance that “all is well”?
Of course we can argue till the cows are home and blue in the face about how US debt levels will become manageable once, or if only, the growth that’s been promised for five years now sets in and blossoms into a full recovery, that will lead us on the path to glory and infinity.
But when you think about it, it’s all not very courageous, is it? The greatest country on earth refuses to face reality, won’t own its crap, and keeps on getting deeper into debt just to hold on to the illusion of grandeur. Of course the whole world does the same, but that’s hardly excuse, and besides, wouldn’t it be better to do the right and noble thing, lead by example, put everyone else to shame, clean up the mess you made and take it from there? Or does anyone really think the present road leads to salvation?


• US Home Builder Sentiment Index Logs Sharpest Drop Ever (CNBC)
Sentiment among the nation’s home builders fell dramatically in February, and while builders blame much of it on the weather, that is not the whole picture. Confidence fell 10 points, according to the National Association of Home Builders’ monthly sentiment index, from 56 to 46—the largest drop in the history of the survey, which started in 1985. Fifty is the line between positive and negative sentiment. The index has not been below 50 since May.
“Significant weather conditions across most of the country led to a decline in buyer traffic last month,” said the association’s chairman Kevin Kelly, a home builder and developer from Wilmington, Del. “Builders also have additional concerns about meeting ongoing and future demand due to a shortage of lots and labor.” Of the three index components, current sales conditions fell 11 points to 51, buyer traffic fell 9 points to 31 and future sales expectations fell 6 points to 54.
“Clearly, constraints on the supply chain for building materials, developed lots and skilled workers are making builders worry,” said the home builder association’s chief economist David Crowe. “The weather also hurt retail and auto sales and this had a contributing effect on demand for new homes.” While it has been popular to blame much of the slowdown in the winter housing market on colder-than-average temperatures and higher-than-average precipitation, some argue that weather can only account for about a 1-2% drop in housing starts and home sales. “Last month was cold, but it wasn’t the coldest January of the Millennium,” noted Jed Kolko, chief economist at Trulia.com.
• Is US Housing Set To Lift Off? (STA)
Given the current economic dynamics of stagnant wage growth, the structural employment shift and tighter lending standards it is unlikely that the consumer will be able to relever their balance sheet as in the past. The chart below shows new home sales as compared to household debt as a% of disposable income.

As I have discussed previously in "What Has Been Forgotten:"
"There is no argument that housing has improved from the depths of the housing crash in 2010. However, while the housing market remains at very recessionary levels, recent analysis assumes that this has been a natural, and organic, recovery. Nothing could be further from the truth as analysts have somehow forgotten the trillions of dollars, and regulatory support, infused to generate that recovery.
The chart below is the Total Housing Activity Index which is an index of all economically important housing activities from new and existing home sales, to permits and starts.
The optimism over the housing recovery has gotten well ahead of the underlying fundamentals. While the belief is that the current push in housing is a side-effect of a recovering economy, the reality may be a function of the speculative rush into buying rental properties for cash which created a temporary, and artificial, inventory suppression.
If we take a look at actual loan demand, we find a much different picture of the real estate market. The following two charts show that demand for loans have peaked and are now on the decline. This leaves the hopes of an economic recovery based on housing somewhat at risk.

The rising risk to the housing recovery story lies in the Fed's ability to continue to keep interest rates suppressed. It is important to remember that individuals "buy payments" rather than houses. With each tick higher in mortgage rates so goes the monthly mortgage payment. With wages remaining suppressed, 1 out of 3 Americans no longer counted as part of the work force, or drawing on a Federal subsidy, the pool of potential buyers remains constrained.

• US Household Borrowing Rises Most in Six Years in NY Fed Survey (Bloomberg)
Consumer debt in the U.S. rose last quarter by the most in more than six years as Americans borrowed to buy homes and cars and to pay for education, according to a survey by the Federal Reserve Bank of New York. Household debt increased 2.1%, or $241 billion, to $11.52 trillion, the biggest gain since the third quarter of 2007, the survey showed. The level of debt last quarter was $180 billion higher than a year earlier, the report showed.
Total indebtedness remains 9.1% below the peak of $12.68 trillion in the third quarter of 2008, the survey showed. Mortgage balances led the rise during the quarter, increasing 1.9%, or $152 billion, to $8.05 trillion, the survey showed. Foreclosures are at the lowest levels since the end of 2005. Auto debt expanded $18 billion to $863 billion during the fourth quarter. Credit-card borrowing climbed $11 billion to $683 billion.
Delinquency rates continued to drop in the fourth quarter, with 7.1% of outstanding debt in some stage of delinquency, down from 7.4% in the third quarter. There were about 332,000 new bankruptcies during the fourth quarter, little changed from a year earlier. From the fourth quarter of 2012 to the end of last year, student-loan debt swelled the most in dollar terms, increasing $114 billion to $1.08 trillion. In the last three months of 2013, education borrowing rose $53 billion.
• US Student Loans At Record $1.08 Trillion; Delinquent At All Time High (Zero Hedge)
While the bulk of the quantity data contained in the Fed’s quarterly Household Debt and Credit Report is known in advance courtesy of the Fed’s monthly tracking of household revolving and non-revolving debt, the quality components always provide a welcome insight into the state of the US household.
It is there that we find that the most disturbing trend in recent years: the encumbering of students with record amounts of loans continues. In fact, as of December 31, the total amount of non-dischargeable (for now) student loans hit a new all time high of $1.08 trillion an increase of $53 billion in the quarter. By comparison, total credit card debt as of the same period was “only” $683 billion. At this rate, total student loans will be double the size of all credit card debt within 2-3 years.
What’s worse, while the 90+ day student debt delinquency rate did post a tiny decline from 11.8% to 11.5% in Q4, on a total notional basis due to the increase in outstanding balances, as of this moment the amount of heavily delinquent student loans has just hit a fresh record high of $124.3 billion, up from $121.5 billion in the prior quarter.

So: when does the Fed finally admit i) there is a student loan problem and ii) the only way to solve said problem is to promptly monetize it?
Finally, putting new “debt” creation in perspective, in 2013 just student and car loans alone represented 108% (that’s right, more than all) of total household debt created.
Source


• More weak U.S. economic data puts cracks in weather theory (Reuters)
U.S. homebuilder confidence suffered its largest one-month drop ever in February, heightening concerns that recent signs of weakness in the economy reflect deeper problems than the severe weather that has gripped much of the country. The National Association of Home Builders said on Tuesday its Housing Market Index plunged by 10 points to 46 in February, with a majority of builders seeing market conditions as poor.
The NAHB, which produces the index together with U.S. bank Wells Fargo, said cold temperatures kept potential home buyers out of the market across much of the country. But the trade group said high costs were also holding back the housing industry, and the data adds to worries the U.S. economy might actually be losing momentum following a year of break-out growth.
Poor weather usually drags on growth only temporarily as businesses and consumers put off purchases. If the recent slowdown in the economy is weather related, economists expect that the trend will reverse once temperatures turn higher and spur consumers to get back to spending. “This report will keep alive concerns in the markets that the weakening in the data recently is not just due to weather,” said Jim O’Sullivan, an economist at High Frequency Economics in Valhalla, New York.
Worries over the outlook for the economy have grown since reports showed weak hiring across the economy in December and January, when much of the country experienced unusually frigid temperatures. Now signs of economic weakness are persisting into February.
Another report on Tuesday showed a gauge of manufacturing in New York state slowed in February. The New York Federal Reserve Bank’s Empire State general business conditions index fell to 4.48 from 12.51 the month before, which was a 20-month high. Economists polled by Reuters had expected a reading of 9.0. The survey of manufacturing plants in New York state is one of the earliest monthly guideposts to U.S. factory conditions.
Investors were caught off guard by the NAHB report, which marked the first time since May that the reading was below the key 50 mark. Readings below 50 mean more builders view market conditions as poor than favorable.
• Marketable U.S. Debt More Than Doubled Under Obama: +106% (CNS)
The marketable debt of the U.S. government has more than doubled – climbing by 106% – while President Barack Obama has been in office, increasing from $5,749,916,000,000 at the end of January 2009 to $11,825,322,000,000 at the end of January 2014, according to the U.S. Treasury’s latest Monthly Statement of the Public Debt. During the eight-year presidency of George W. Bush, the marketable debt of the U.S. government almost doubled–climbing 93%–from $2,977,328,000,000 at the end of January 2001 to $5,749,916,000,000 at the end of January 2009.
During the time that Bush and Obama have been in office, the marketable debt of the U.S. government has nearly quadrupled, increasing by $8,847,994,000,000.However, despite the massive increase in the government’s marketable debt during Bush’s eight years, Obama managed to accumulate more additional marketable debt in his first five years in office than all the presidents who preceded combined.
The marketable debt of the U.S. government includes all debt securities sold by the U.S. Treasury that can be held by individuals, corporations or other entities outside the U.S. government and that can be sold in the secondary market. It does not include money the Treasury has borrowed out of government trust funds—such as the Social Security Trust Fund—to spend on other government expenses when those trust funds were running surpluses.
The marketable debt of the U.S. government now includes Treasury bills, which mature in 52 weeks or less; Treasury notes, which have maturities between 2 and 10 years; Treasury bonds, which mature in 30 years; Treasury Inflation-Protected Securities (TIPS), which have maturities of 5, 10 and 30 years; and Floating Rate Notes (FRNs), which are sold on 2-year terms.
At the end of January 2009, the month Obama took office, the marketable debt of the U.S. government was $5,749,916,000,000, according the Treasury’s Monthly Statement of the Public Debt. This included $1,792,889,000,000 in Treasury bills held by the public; $2,825,174,000,000 in Treasury notes held by the public; $591,174,000,000 in Treasury bonds; and $516,209,000,000 in TIPS. It also included $23,754,000,000 in marketable Treasury bills, notes, bonds, TIPS and Federal Financing Bank notes that, according to the Treasury, were held by federal agencies.
In addition to the $5,749,916,000,000 in marketable debt as of the end of January 2009, the Treasury also reported $4,882,164,000,000 in nonmarketable debt owed by the government at that time, including $4,291,027,000,000 in nonmarketable intragovernmental debt.
By the end of January 2014, the marketable debt of the U.S. government had increased to $11,825,322,000,000. This included $1,484,438,000,000 in Treasury bills held by the public; $7,922,464,000,000 in Treasury notes held by the public; $1,421,110,000,000 in Treasury bonds held by the public; $959,058,000,000 in TIPS held by the public, and $15,000,000,000 in FRNs held by the public. There was also $23,252,000,000 in marketable debt held by government agencies.
In addition to the $11,825,322,000,000 in marketable debt as of the end of January 2014, the Treasury also reported $5,467,698,000,000 in nonmarketable debt, including $4,961,625,000,000 in nonmarketable intragovernmental debt. From January 2009 to January 2014, the marketable debt of the U.S. government increased $6,075,406,000,000—or about 106%
The Federal Reserve is now the largest owner of the U.S. government’s marketable debt. As of Feb. 12, 2014, according to the Fed’s latest balance sheet, the Fed owned $2,261,099,000,000 in U.S. Treasury securities. Entities in the People’s Republic of China are the second largest owners of the U.S. government’s marketable debt. As of the end of December, according to data released by the U.S. Treasury today, the Chinese owned $1,268,900,000,000 in U.S. Treasury securities—down from $1,316,700,000,000 at the end of November.
In January 2014, according to the Treasury, the U.S. paid an average interest rate of only 1.998% on its marketable debt. In January 2009, when Obama took office, the Treasury was paying an average interest rate of 3.116% on its marketable debt; and, in January 2001, when President George W. Bush took office, the Treasury was paying an average interest rate of 6.620% on its marketable debt. That means that the average interest rate on the U.S. government’s marketable debt is currently less than a third of what it was in 2001—when the U.S. had only $2,977,328,000,000 in marketable debt, or about 25% of the marketable debt it has now. Also in January 2001, the Federal Reserve owned only $518,441,000,000 in U.S. Treasury securities, or about 23% of what it owns now.
• Foreign Holdings of US Treasury Debt Hit Record (AP)
Foreign buyers of U.S. Treasury securities increased their holdings to a record in December even though the two largest holders of U.S. government debt — China and Japan — reduced their shares. The Treasury Department says total foreign holdings rose 1.4% in December to $5.79 trillion, surpassing the old record set in March of $5.73 trillion. Foreign holdings had fallen from April through July before rising again in August.
China, the largest foreign buyer of Treasury debt, reduced its holdings to $1.27 trillion in December. That marked a 3.6% drop from China’s November level of $1.32 trillion, a record for that country. Japan, the second-largest buyer, trimmed its holdings to $1.18 trillion in December. That was down 0.3% from November’s total, a record for Japan.
• Foreign Purchases Of US Securities Take Out Lehman Low (Zero Hedge)
As we reported earlier today, for whatever reason China sold the second biggest amount of US Treasurys in December. However, that was only part of the story. In fact, as we also noted, while the two largest US foreign creditors were net sellers, total foreign bond holdings actually rose in the last month of 2013 and as the chart below confirms, when it comes to Long-Term Treasury paper, foreigners were actually buyers of some $18 billion in Treasurys. It is everything else that they sold in the month when the S&P hit its all time high: specifically, foreigners were net sellers of Agency securities ($15.4 billion), Corporate Bonds ($7.5 billion) and Corporate Equities ($13.7 billion) something which hardly fits with the narrative of the record stock market high generating confidence in even more buying down the line.

In the chart above it is the black line – gross purchases of US long-term securities – that is the most troubling, as its trend is hardly anyone’s friend.
So what happens when one smooths out the line to normalize for monthly fluctuations? This:
The chart is very disturbing: it shows that as the S&P rises higher and higher (on ever declining volumes), foreigners are buying fewer and fewer US securities. In fact, on a 12 Month Moving Average basis, foreigners bought less long-term US securities than they did when Lehman crashed!
Luckily we live in a New Normal when price is no longer determined by simple supply and demand (and certainly not from retail investors who have long since given up on the fraudulent, broken US capital “markets”) but Fed jawboning of a record $2.5 trillion in bank excess reserves, corporate buybacks and HFT algos spurring momentum ignition and buying because others are buying.
And so we have come full circle, because while, understandably, nobody had any appetite for US securities around the Lehman crash when, until the Fed stepped in and singlehandedly took over the US capital markets, it was unclear if there even would be a US capital markets, now that five years later the S&P has risen to a level nearly three times the March 2009 lows thanks entirely to the Fed’s $4.1 trillion balance sheet backstop, the interest in US securities is… lower than it was in the days just after Lehman!

• China Sold Second-Largest Amount Ever Of US Treasurys In December (Zero Hedge)
While we will have more to say about the disastrous December TIC data shortly, which was released early today, and which showed a dramatic plunge in foreign purchases of US securities in December – the month when the S&P soared to all time highs and when everyone was panicking about the 3% barrier in the 10 Year being breached and resulting in a selloff in Tsy paper – one thing stands out. The chart below shows holdings of Chinese Treasurys (pending revision of course, as the Treasury department is quite fond of adjusting this data series with annual regularity): in a nutshell, Chinese Treasury holdings plunged by the most in two years, after China offloaded some $48 billion in paper, bringing its total to only $1268.9 billion, down from $1316.7 billion, and back to a level last seen in March 2013!

This was the second largest dump by China in history with the sole exception of December 2011.

That this happened at a time when Chinese FX reserves soared to all time highs, and when China had gobs of spare cash lying around and not investing in US paper should be quite troubling to anyone who follows the nuanced game theory between the US and its largest external creditor, and the signals China sends to the world when it comes to its confidence in the US.
Yet what was truly surprising is that despite the plunge in Chinese holdings, and Japanese holdings which also dropped by $4 billion in December, is that total foreign holdings of US Treasurys increased in December, from $5716.9 billion to 5794.9 billion. Why? Because of this country. Guess which one it is without looking at legend.

That’s right: at a time when America’s two largest foreign creditors, China and Japan, went on a buyers strike, the entity that came to the US rescue was Belgium, which as most know is simply another name for… Europe: the continent that has just a modest amount of its own excess debt to worry about. One wonders what favors were (and are) being exchanged behind the scenes in order to preserve the semblance that “all is well”?


This is how China tightens? Add $15 trillion over 5 years and then remove $8 billion?
• China removes $8 billion from money markets to control lending (BBC)
China’s central bank has removed nearly $8bn (£4.7bn) from the money markets in a bid to control the amount of credit in the country’s financial system. According to reports, the People’s Bank of China (PBOC) did so by issuing 14-day forward bond repurchase agreements, also known as forward repos. It is the first time since June the PBOC has used forward repos, and comes after China released unusually strong economic data earlier this year. Chinese stocks fell in Shanghai.
A trader at a Chinese commercial bank in Shanghai told the Reuters news agency that the move “sent a strong signal to the markets that the central bank is not letting liquidity ease”. “If money market conditions remain sloppy, the central bank could even step up efforts to mop up excess,” he said.
China has been looking to suck excess cash from its open-market operations to reduce the risks of shadow banking, or informal lending to businesses. Shadow banking has been identified as a major risk to China’s future growth, because of the possibility of large debts turning sour.
Chinese banks traditionally see a spurt in lending at the beginning of the year, as businesses and consumers borrow money to fund spending in the new year. In January, new local currency loans nearly tripled from the month before to $218bn. By reducing the amount of money available, the government makes it harder for banks to borrow and move the money into risky investments.
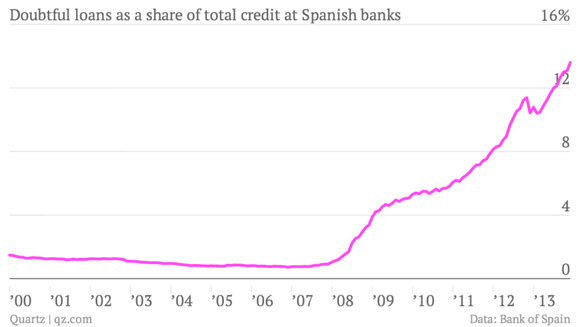
Look, if 13.6% of the loans in your banking system are non-performing, then you have a really big problem. So can we stop using the words “Spain” and “recovery” in the same sentence? Spain must sweep up the mess, and shut up until it does.
• Spanish Bad Loans Ratio Rises to Record 13.6% (Bloomberg)
Bad loans as a proportion of total lending in Spain rose to record in December as companies and consumers kept missing payments in an economy that’s still not growing fast enough to create new jobs. Non-performing loans accounted for 13.6% of lending compared with 13.1% in November and 10.4% a year earlier, the Bank of Spain said on its website today. The stock of bad loans rose to €197 billion ($270 billion) as €4.57 billion of loans turned sour.
“We are close to the end of this increase,” European Central Bank Governing Council member Luis Maria Linde, also governor of the Bank of Spain, told reporters in Madrid today. Linde said he expects economic growth to pick up enough to create jobs in Spain this year.
Spanish banks rose this year in Madrid trading as lenders including Bankinter said bad loans may be nearing their peak after the country emerged from two recessions. Even so, the Feb. 13 decision by Standard & Poor’s to cut the debt rating of Banco Popular Espanol served as a reminder to investors that some lenders are still struggling to stem asset losses.
Lending fell 1.6% on the month and 9.8% from a year earlier, the Bank of Spain said. The shrinking loan book makes the bad loans ratio higher, Economy Minister Luis de Guindos said during a news conference in Brussels today. Guindos last month said there are signs lending is recovering. “The stock of non-performing loans will continue to go up for some time but the longer-term trend does now look more favorable,” said Carlos Joaquim Peixoto, an analyst at Banco BPI SA in Porto, Portugal, in a phone interview.
Nice analogy. $270 billion in bad loans are far more than Spain can carry. Write them down, restructure, default.
• Spanish banks’ bad debt worth as much as entire Singapore economy (Quartz)
The combination of high unemployment and plunging property prices is bad news for Spanish banks. How bad? Non-performing loans have set a new record, according to data released today. Doubtful loans in December were worth a whopping €197 billion ($270 billion), roughly the same as the annual GDP of Singapore.
Just under 14% of all Spanish bank loans are now behind on payments, and this ratio is likely to get worse before it gets better. Even after the recent declines, by most measures Spanish property remains overvalued by around 10% versus long-term averages (link in Spanish). With the labor market improving very slowly, borrowers will continue to struggle to service their loans. The economy is out of recession, but growth remains anemic.
Unsurprisingly, banks have been reining in lending, with credit falling at a 10% annual pace in the latest data. Less lending means less of a chance for loans to go bad, but this also limits the Spanish economy’s ability to grow. Investors may be keen on Spanish assets, anticipating an economic recovery, but for the foreseeable future the size of the country’s bad debt pile will be one indicator unlikely to move in the right direction.
And Italy has “only” $156 billion in bad loans. This is five years after the crisis started. Why is no-one trying to solve this? New PM, new government, but I bet you they’re not planning a clean sweep.
• Italy’s Troubled Banks Crammed with €156 billion in Bad Loans (IBT)
Italian banks had €156 billion in bad loans on their balance sheets at the of 2013 – 8.1% of total loans in the Italian banking system and the highest level since May 1999, according to Italy’s Bankers’ Association (AIB).
The figure, produced in AIB’s monthly report on lenders, is in line with what the Bank of Italy published and came amid widespread turmoil in Italy’s political system and revelations that the banking system might be much weaker than previously thought. Italian lenders raised €33 billion fewer funds from clients compared to the previous month, a 1.9% drop compared to a year earlier.
Meanwhile, Bloomberg reported that two Italian banks had provided poor quality data to the ongoing review of the eurozone’s banking system being conducted by the European Central Bank. Bloomberg said it had seen a document submitted to the Bank of Italy on 10 February which showed that three out of 15 banks taking part in the eurozone’s stress test clampdown on weak banks had given poor data.
The European Banking Authority and ECB are trying to diagnose the health of banks as it moves into a position to supervise the continent’s financial system. ECB officials have made it clear that they want to know about any vulnerabilities in the financial system before they assume the supervisory role, which will see the central bank’s powers greatly expanded. Fitch Ratings revealed that Spanish companies have seen a 45% jump in their debt issuance in 2013.
Meanwhile, other countries rocked by the European sovereign debt crisis such as Greece, Ireland, Italy and Portugal saw bond issuance increase by 22% over the same period. Italy saw its corporate issuance fall by 9%. Two previous stress tests conducted by the ECB failed to be useful at detecting weaknesses on many banks’ balance sheets. Significantly, Spanish and Irish banks that underwent these stress tests were spectacularly exposed in the eurozone’s sovereign debt crisis that erupted in 2010.
How far will Argentina fall this time around?
• Argentina tries to delay $1.3 billion repayment to creditors (BBC)
Argentina will on Tuesday petition the US courts to try to stall a $1.3 billion repayment to its creditors. If the petition to the Supreme Court is not successful, the country risks triggering a default and debt crisis. The money is owed to creditors who refused to participate in a debt restructuring process arising from the country’s $100 billion default 12 years ago.
Most bondholders agreed to accept a hefty discount on what they were owed, but those who held out are demanding to be repaid in full. President Cristina Fernandez de Kirchner has said her government will honour payments to those who accepted the debt swaps, but will pay nothing to the creditors who held out, including hedge funds NML Capital and Aurelius Capital Management. She has described the hold-out creditors as “vulture funds”.
Argentina has already defaulted on its debt three times in its history. The last occasion, in 2002, brought the country to its knees. Meanwhile, inflation is 25% and the peso fell 19% in January. The president has blamed supermarkets and oil companies.
Squeeze the foreigners!
• Fed Adopts Foreign-Bank Capital Rules as World Finance Fragments (Bloomberg)
The Federal Reserve approved new standards for foreign banks that will require the biggest to hold more capital in the U.S., joining other countries in erecting walls around domestic financial systems.
Banks with $50 billion of assets in the U.S. will have to meet the standard under a revised rule approved yesterday, which raised the threshold from $10 billion proposed in 2012. The central bank left out two controversial elements of the original proposal, saying those were still being developed.
Walling off U.S. units of foreign banks, designed to protect taxpayers from having to bail them out in a crisis, may increase those companies’ borrowing costs and hurt their profitability. The firms say it will also raise borrowing rates for governments and consumers.
“This implies concern by policy makers in the U.S. regarding the speed and robustness of the evolving European framework for bank resolution,” said Barbara Matthews, managing director of BCM International Regulatory Analytics LLC, a Washington-based consulting firm. “It will put pressure on the Europeans to push ahead with a strong resolution regime.”
The new standards take effect in July 2016, one year later than originally proposed after the final approval of the regulation was delayed. Part of the proposal that established limits on banks’ exposures to single parties was held back because the Fed is still working on how to define them for U.S. firms. Another planned change, which would have set an additional capital buffer above the standard requirements, also was left out. The industry objected to both elements.
The new rules will force the largest foreign firms to consolidate U.S. operations into one subsidiary and abide by the same capital and liquidity minimums as domestic peers. The change in the threshold will lower the number of firms that have to set up such holding companies to about 17 from 25, a Fed official estimated.
Apparently, Beijing doesn’t want to face up to reality anymore than Washington does.
• Beijing giving foreign economists the cold shoulder (SCMP)
Chinese government officials have quietly become more sceptical about foreign banks’ research reports and are avoiding senior economists at global banks, partly because of growing mutual distrust over the scale and seriousness of the country’s debt problems.
Economic researchers and people working for state-owned media told the South China Morning Post that the central government’s propaganda department had instructed senior editors at major official media outlets to be cautious about whom they invite to talk about China’s economy and what they might say about the problems and challenges it faces after its long run of supercharged growth.
“There’s no black list or white list, but it’s clear we are now being encouraged to invite economists and analysts with domestic securities firms and banks to talk about China’s economy, especially on live broadcasts,” said one mainland media source who declined to be named given the sensitive nature of the matter.
The mainland’s fiscal position is weaker than official data shows but not significant enough to cause alarm, the International Monetary Fund said last month. The IMF warned that the mainland had become “more vulnerable to a macroeconomic shock” because of its higher debt and bigger deficit. It estimated augmented fiscal debt, which mainly refers to borrowing by local governments, had risen to about 45 per cent of the country’s 51.9 trillion yuan (HK$66 trillion) gross domestic product in 2012. Many economists at foreign banks shared the IMF’s concern.
There are other signs that economists at foreign banks have apparently lost favour in Beijing. For example, the China Banking Regulatory Commission used to invite some economists from foreign banks to closed-door meetings about the development of the country’s banking industry, typically with a focus on its lending policy. But since last year, such meetings have been significantly reduced.
Invitations are now being sent to only a small number of economists at foreign banks whom the CBRC considers trustworthy, two China-focused economists who have a working relationship with the CBRC said. “The general sentiment has clearly changed. The central bank and the regulators are more cautious about what they can tell you,” said one of the economists.
The Australian government simply says there “have always been tough times and lush times”. With their hand on the bible? Plague of locusts anyone?
• Heatwave frequency ‘surpasses levels previously predicted for 2030’ (Guardian)
The government has been urged to better articulate the dangers of climate change after a report that shows the frequency of heatwaves in parts of Australia has already surpassed levels previously predicted for 2030. The Climate Council report highlights that Adelaide, Melbourne and Canberra all experienced a higher average number of hot days between 2000 and 2009 than was expected to occur by 2030.
Research by the CSIRO forecast that Melbourne would experience an average of 12 days over 35C each year from 2030, but the average over the past decade was 12.6 days. Adelaide experienced an average of 25.1 days a year over 35C in this time, while Canberra surpassed this mark an average of 9.4 days.
The annual number of record hot days across Australia has more than doubled since 1950, according to the Climate Council report, with the south-east of the country at particular risk from more frequent heatwaves, drought and bushfires. Last month’s heatwave, which enveloped much of Victoria and South Australia, caused 203 heat-related deaths in Victoria alone, according to the report.
Tim Flannery, of the Climate Council, told Guardian Australia that heatwaves were the “most dangerous natural hazards in Australia”. “They kill hundreds of people and the fact they are accelerating beyond the predicted trends is a concern,” he said. “Heatwaves are coming earlier, they are lasting longer and they are hotter. They build up for days and before you know it, elderly people, infants and the homeless are in danger.”
On Monday, Tony Abbott dismissed talk of a link between climate change and drought, saying there “have always been tough times and lush times”. Last year he played down the connection between climate change and bushfire. Flannery said there was “clear evidence” of these links and said the government had yet to articulate the dangers of climate change and how it would combat it. “We’re not looking at these things in a linked-up way, we don’t seem to recognise the relationship between the number and intensity of heatwaves on bushfires, and the impact on droughts,” he said. “It’s an inconvenient truth and people don’t want to face the truth.

This must be why we shot only 10,000 elephants last year.
• Elephants Comfort Each Other in Times of Distress (HealthDay)
Asian elephants use touch and sound to console other elephants in distress, according to a new study. It’s the first study to confirm that elephants comfort one another in difficult times, the researchers said. Along with humans, this type of behavior has been verified only in great apes, canines and a family of birds called corvids, which includes crows, ravens and blue jays.
“For centuries, people have observed that elephants seem to be highly intelligent and empathic animals, but as scientists we need to actually test it,” study lead author Joshua Plotnik, who began the research as a graduate student of psychology at Emory University, said in a university news release. Plotnik is currently a lecturer in conservation biology at Mahidol University in Thailand and CEO of Think Elephants International, a nonprofit education and conservation group.
The researchers spent nearly a year recording stressful events — such as the presence of potentially dangerous animals or unfriendly elephants — and responses among 26 captive Asian elephants at a camp in northern Thailand. When responding to a distressed elephant, other elephants would often use their trunks to gently touch the upset elephant’s face or put their trunks in its mouth, which is almost like a handshake or hug in humans, Plotnik said. “It’s a very vulnerable position to put yourself in, because you could get bitten,” he said. “It may be sending a signal of, ‘I’m here to help you, not hurt you.'”
Vocalization was another method of consolation. “The vocalization I heard most often following a distress event was a high, chirping sound,” Plotnik said. “I’ve never heard that vocalization when elephants are alone. It may be a signal like, ‘Shhh, it’s OK’ — the sort of sounds a human adult might make to reassure a baby.”


This article addresses just one of the many issues discussed in Nicole Foss’ new video presentation, Facing the Future, co-presented with Laurence Boomert and available from the Automatic Earth Store. Get your copy now, be much better prepared for 2014, and support The Automatic Earth in the process!
Home › Forums › Debt Rattle Feb 19 2014: Bad! Bad Data!