Jack Delano Gallup, New Mexico. Train on the Atchison, Topeka & Santa Fe 1943
Some things you CAN see coming, in life and certainly in finance. Quite a few things, actually. Once you understand we’re on a long term downward path, also both in life and in finance, and you’re not exclusively looking at short term gains, it all sort of falls into place. The only remaining issue then is that so many of you DO look at short term gains only. Thing is, there’s no way out of this thing but down, way down.
Yeah, stock markets went up quite a bit last week. Did that surprise you? If so, maybe you’re not in the right kind of game. You might be better off in Vegas. Better odds and all that. From where we’re sitting, amongst the entire crowd of its peers, this was a major flashing red alarm late last week, from Investment Research Dynamics:
September Liquidity Crisis Forced Fed Into Massive Reverse Repo Operation
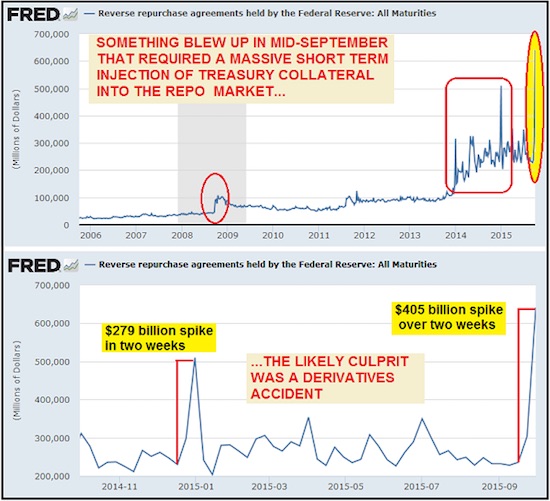
Something occurred in the banking system in September that required a massive reverse repo operation in order to force the largest ever Treasury collateral injection into the repo market. Ordinarily the Fed might engage in routine reverse repos as a means of managing the Fed funds rate. However, as you can see from the graph below, there have been sudden spikes up in the amount of reverse repos that tend to correspond the some kind of crisis – the obvious one being the de facto collapse of the financial system in 2008. You can also see from this graph that the size of the “spike” occurrences in reverse repo operations has significantly increased since 2014 relative to the spike up in 2008. In fact, the latest two-week spike is by far the largest reverse repo operation on record.

Besides using repos to manage term banking reserves in order to target the Fed funds rate, reverse repos put Treasury collateral on to bank balance sheets. We know that in 2008 there was a derivatives counter-party default melt-down. This required the Fed to “inject” Treasury collateral into the banking system which could be used as margin collateral by banks or hedge funds/financial firms holding losing derivatives positions OR to “patch up” counter-party defaults (see AIG/Goldman).
What’s eerie about the pattern in the graph above is that since 2014, the “spike” occurrences have occurred more frequently and are much larger in size than the one in 2008. This would suggest that whatever is imploding behind the scenes is far worse than what occurred in 2008. What’s even more interesting is that the spike-up in reverse repos occurred at the same time – September 16 – that the stock market embarked on an 8-day cliff dive, with the S&P 500 falling 6% in that time period. You’ll note that this is around the same time that a crash in Glencore stock and bonds began. It has been suggested by analysts that a default on Glencore credit derivatives either by Glencore or by financial entities using derivatives to bet against that event would be analogous to the “Lehman moment” that triggered the 2008 collapse.
The blame on the general stock market plunge was cast on the Fed’s inability to raise interest rates. However that seems to be nothing more than a clever cover story for something much more catastrophic which began to develop out of sight in the general liquidity functions of the global banking system. Without a doubt, the graphs above are telling us that something “broke” in the banking system which necessitated the biggest injection of Treasury collateral in history into the global banking system by the Fed.
That should scare even the crocodile hunter, I venture, but he’s dead, and you’re not. So move one to the next sign that you’re in way over your head. How about Tyler Durden quoting Bank of America. Turns out, last week’s gains were down to one thing, and one only: short covering. In fact, the second biggest short squeeze in history. So much short covering that stock prices went up. And that’s why they did.
Stocks Soar To Best Week In A Year On “Mother Of All Short Squeezes”
With China shut and The Fed going full dovish panic-mode over growth fears, world markets went crazy…
• S&P up 7 of last 8 days +3.2% – best week since Oct 2014
• Russell 2000 +4.5% – best week since Oct 2014
• Nasdaq up 7 of last 8 (since Death Cross) closed above 50DMA
• Trannies up 8 of last 9 +4.9% – best week since Oct 2014
• Dow up 8 of last 9 +3.5% – best week since Feb 2015
• "Most Shorted" +4.7% – biggest squeeze in 8 months
• Biotechs -2.3%
• Financials +2.2% – best week in 3 months
• Asian Dollar Index +1.4% (worst week USD vs Asian FX since Oct 2011)
• Dollar Index -1.2% (worst week for USD vs Majors in 2 months)
• AUD +4% – best week since Dec 2011
• 2Y TSY Yields +6.5bps – biggest rise in 7 weeks
• 5Y TSY Yields +11bps – biggest rise in 4 months
• WTI Crude +8.9% – 2nd best week since Feb 2011
• OJ +4.8% – best day since March
• Silver +3.8% – best week since MayLOLume!!
The last 8 days have seen a massive short-squeeze… 2nd biggest in history
The last 2 times stocks were short-squeezed this much, did not end well…
And the following stunning chart shows the percent of S&P 500 names above their 50-day moving-average has soared from 4% to 60% in a few weeks…
h/t @ReformedBroker
Got that? The biggest injection of Treasury collateral in history combined with the 2nd biggest short squeeze in history. Still want to buy stocks? Think there’ll be an actual recovery?
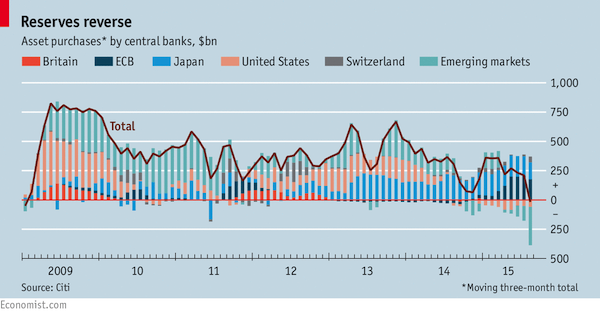
And then there’s this mass selling of Treasuries by emerging markets, as per the following Economist graph.

How many trillions are we down so far? And you still want to buy ‘assets’? You sure you can spell the word please? Josh Brown at the Reformed Broker thinks maybe that’s not the smartest move around:
QE Causes Deflation, Not Inflation
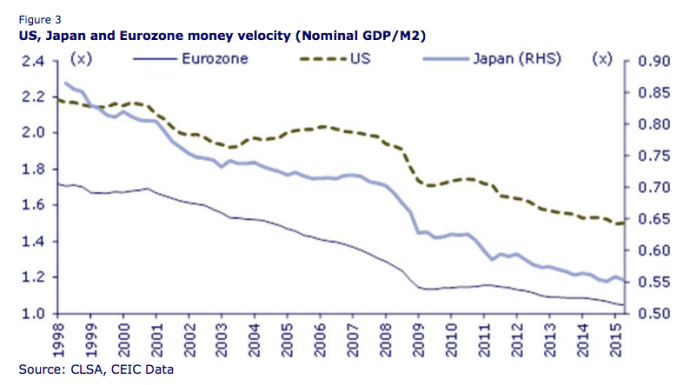
In America, Japan and the Eurozone velocity has continued to decline since the financial crisis in 2008. Thus, US, Japan and Eurozone money velocity, measured as the nominal GDP to M2 ratio, has declined from 1.94x, 0.7x and 1.29x respectively in 1Q98 to 1.5x, 0.55x and 1.05x in 2Q15.
Indeed, US money velocity is now at a six-decade low. This is why those who have predicted a surge in inflation in recent years caused by the Fed printing money have so far been proven wrong. For inflation, as defined by conventional economists like Bernanke in the narrow sense of consumer prices and the like, will not pick up unless the turnover of money increases. This is the problem with the narrow form of mechanical monetarism associated with the likes of American economist Milton Friedman.

[..] QE is deflationary because it shrinks net interest margins for banks via depressing treasury bond yields. It also enriches the already wealthy via asset price inflation but they do not raise their consumption in response, because how much more shit can they possibly buy? Finally, it leads to a preference of share buybacks vs investment spending because the payback from financial engineering is so much easier and more immediate.
Now, we’re not sure that QE ’causes’ deflation, or let’s put it this way: perhaps QE doesn’t cause the deflation we see, but it certainly reinforces it. ‘Our’ deflation originates in our debt. And there’s more than plenty of that to go around.
More is still being added on a daily basis. Though we’re approaching the limits of that. Which is a good thing on the one hand, but a bad one on the other: we’re all going to feel like heroine junkies going cold turkey. Not a pleasant feeling. But still healthier in the long run.
That US money velocity is at its lowest pace in 60(!) years -do let that one sink in- is a huge component of what deflation really is: not rising or falling prices, but the interaction of falling/rising money supply vs falling/rising money velocity.
And in that sense, isn’t it interesting to note that “US money velocity is now at a six-decade low.”?! And that, accordingly, no matter how much money is injected into the economy, if it is not being spent, deflation is inevitable?!
Why is it not being spent? Because America, wherever you look, and at whatever level, the country is drowning in debt. And so is the rest of the planet. If a large enough part of your ‘gains’ goes toward paying of what you’ve already spent in the past, you’re just a hamster on a wheel. Well, hamsters rule the planet.
And, now that we’re talking about it, deflation is inevitable anyway in the aftermath of the by far biggest credit mountain in the history of not just mankind, but of the planet, if not the universe.
It may be hard to let sink in if you and/or your pension fund own large(-ish) portfolios of stocks and bonds, or if you make a living trading the stuff, but come on, how long do you think you can keep the charade going? or should that be: ‘could keep it going’?
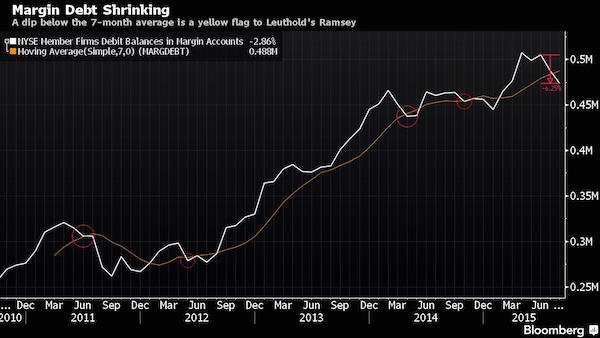
To add insult to injury, Bloomberg tells us that margin dent is falling fast in ‘da markets’. Ergo: smarter money is paying its money down, before too much of it vanishes into the great beyond. Watch that graph and imagine it going all the way back down to 2012, and then think about where your ‘assets’ will be.
Margin Debt in Freefall Is Another Reason to Worry About S&P 500

Most people get concerned about margin debt when it’s shooting up. To Doug Ramsey, the problem now is that it’s falling too fast. The CIO of Leuthold Weeden whose pessimistic predictions came true in August’s selloff, says the tally of New York Stock Exchange brokerage loans flashed a bearish sign when it slid more than 6% in July and August. The retreat took margin debt below a seven-month moving average that suggests demand for stocks is dropping at a rate that should give investors pause. For years, bull market skeptics have warned that surging equity credit portended disaster for U.S. shares, pointing to a threefold runup between the market low in March 2009 and the middle of this year. Ramsey, who says that surge was never strong enough to form the basis of a bear case, is now worried about how fast it’s unwinding.
“Margin debt contracting is a sign of loss of investor confidence and it’s confirmation of a lot of other evidence we have that we’ve entered a cyclical bear market,” Ramsey said in a phone interview. “We got a lot of traditional warning signs leading up to the high in terms of market action, and deteriorating breadth and margin debt is important to the supply-demand analysis.” Margin debt, compiled monthly by the NYSE, represents credit extended by brokerages for clients to buy stock. It hews closely to benchmark indexes such as the S&P 500, primarily because equity is used to back the loans and as its value rises, so does the capacity to lend.
Of course, the entire global economy has been hanging together with strands of duct tape for decades now, but hey, it looks good as long as you don’t take a peek behind the facade, right? But you know, it all comes together in that money velocity graph earlier.
People have massively toned down their spending, some because they’ve grown wary of what’s going on, but most because they either have nothing left to spend or they are too deep in debt to have anything left after they pay their money down.
And there’s no cure for that. Not even a people’s QE will do it, no matter what shape it would come in. The entire world economy would need to restructure its various debt levels.
Problem with that is, A) we’ve already committed to bail out our banks at the cost of our entire societies, and B) we largely owe our debts to those same banks. So why should they let us off the hook now? They own us.
Meanwhile, even if you think that last bit is silly, how do you yourself think you can squeeze your behind out of the massive short squeeze that happened last week? By purchasing shares? Really?


Home › Forums › Short Squeeze, Liquidity, Margin Debt and Deflation