Jun 262017
 
 June 26, 2017  Posted by at 11:49 am Finance Tagged with: , , , , , , , , , ,  12 Responses »


Paul Klee Ghost of a Genius 1922


The Automatic Earth has written many articles on the topic of EROEI (Energy Return on Energy Invested) through the years, there’s a whole chapter on it in the Automatic Earth Primer Guide 2017 that Nicole assembled recently, which contains 17 different articles.

Still, since EROEI is the most important energy issue there is at present, and not the price of oil or some new gas find or a set of windmills or solar panels or thorium, it can’t hurt to repeat it once again, in someone else’s words and from someone else’s angle. This one comes from Brian Davey on his site CredoEconomics, part of his book “Credo”.

It can’t hurt to repeat it because not nearly enough people understand that in the end everything, the survival of our world, our way of life, is all about the ‘quality’ of energy, about what we get in return when we drill and pump and build infrastructure, what remains when we subtract all the energy used to ‘generate’ energy, from (or at) the bottom line.

Anno 2017, our overall ‘net energy’ is nowhere near where it was for the first 100 years or so after we started using oil. And there’s no energy source that comes close to -conventional- oil (and gas) when it comes to what we are left with once our efforts are discounted, in calories or Joules.

The upshot of this is that even if we can ‘gain’ 10 times more than we put in, in energy terms, that won’t save our complex societies. To achieve that, we would need at least a 15:1 ratio, a number straight from our friend Charlie Hall, which is probably still quite optimistic. And we simply don’t have it. Not anymore.

Also, not nearly enough people understand that it has absolutely nothing to do with money. That you can’t go out and buy more or better energy sources. Which is why we use EROEI instead of EROI (Energy Return on Investment), because the latter leaves some sort of financial interpretation open that doesn’t actually exist, it suggests that a financial price of energy plays a role.

First, here’s Nicole from the Automatic Earth Primer Guide 2017. Below that, Brian Davey’s article.


Nicole Foss: Energy is the master resource – the capacity to do work. Our modern society is the result of the enormous energy subsidy we have enjoyed in the form of fossil fuels, specifically fossil fuels with a very high energy profit ratio (EROEI). Energy surplus drove expansion, intensification, and the development of socioeconomic complexity, but now we stand on the edge of the net energy cliff. The surplus energy, beyond that which has to be reinvested in future energy production, is rapidly diminishing.

We would have to greatly increase gross production to make up for reduced energy profit ratio, but production is flat to falling so this is no longer an option. As both gross production and the energy profit ratio fall, the net energy available for all society’s other purposes will fall even more quickly than gross production declines would suggest. Every society rests on a minimum energy profit ratio. The implication of falling below that minimum for industrial society, as we are now poised to do, is that society will be forced to simplify.

A plethora of energy fantasies is making the rounds at the moment. Whether based on unconventional oil and gas or renewables (that are not actually renewable), these are stories we tell ourselves in order to deny that we are facing any kind of future energy scarcity, or that supply could be in any way a concern. They are an attempt to maintain the fiction that our society can continue in its current form, or even increase in complexity. This is a vain attempt to deny the existence of non-negotiable limits to growth. The touted alternatives are not energy sources for our current society, because low EROEI energy sources cannot sustain a society complex enough to produce them.


Using Energy to Extract Energy – The Dynamics of Depletion


Brian Davey: The “Limits to Growth Study” of 1972 was deeply controversial and criticised by many economists. Over 40 years later, it seems remarkably prophetic and on track in its predictions. The crucial concept of Energy Return on Energy Invested is explained and the flaws in neoclassical reasoning which EROI highlights.

The continued functioning of the energy system is a “hub interdependency” that has become essential to the management of the increasing complexity of our society. The energy input into the UK economy is about 50 to 70 times as great as what the labour force could generate if working full time only with the power of their muscles, fuelled up with food. It is fossil fuels, refined to be used in vehicles and motors or converted into electricity that have created power inputs that makes possible the multiple round- about arrangements in a high complex economy. The other “hub interdependency” is a money and transaction system for exchange which has to continue to function to make vast production and trade networks viable. Without payment systems nothing functions.

Yet, as I will show, both types of hub interdependencies could conceivably fail. The smooth running of the energy system is dependent on ample supplies of cheaply available fossil fuels. However, there has been a rising cost of extracting and refining oil, gas and coal. Quite soon there is likely to be an absolute decline in their availability. To this should be added the climatic consequences of burning more carbon based fuels. To make the situation even worse, if the economy gets into difficulty because of rising energy costs then so too will the financial system – which can then have a knock-on consequence for the money system. The two hub interdependencies could break down together.

“Solutions” put forward by the techno optimists almost always assume growing complexity and new uses for energy with an increased energy cost. But this begs the question- because the problem is the growing cost of energy and its polluting and climate changing consequences.


The “Limits to Growth” study of 1972 – and its 40 year after evaluation

It was a view similar to this that underpinned the methodology of a famous study from the early 1970s. A group called the Club of Rome decided to commission a group of system scientists at the Massachusetts Institute of Technology to explore how far economic growth would continue to be possible. Their research used a series of computer model runs based on various scenarios of the future. It was published in 1972 and produced an instant storm. Most economists were up in arms that their shibboleth, economic growth, had been challenged. (Meadows, Meadows, Randers, & BehrensIII, 1972)

This was because its message was that growth could continue for some time by running down “natural capital” (depletion) and degrading “ecological system services” (pollution) but that it could not go on forever. An analogy would be spending more than one earns. This is possible as long as one has savings to run down, or by running up debts payable in the future. However, a day of reckoning inevitably occurs. The MIT scientists ran a number of computer generated scenarios of the future including a “business as usual” projection, called the “standard run” which hit a global crisis in 2030.

It is now over 40 years since the original Limits to Growth study was published so it is legitimate to compare what was predicted in 1972 against what actually happened. This has now been done twice by Graham Turner who works at the Australian Commonwealth Scientific and Industrial Research Organisation (CSIRO). Turner did this with data for the rst 30 years and then for 40 years of data. His conclusion is as follows:

The Limits to Growth standard run scenario produced 40 years ago continues to align well with historical data that has been updated in this paper following a 30-year comparison by the author. The scenario results in collapse of the global economy and environment and subsequently, the population. Although the modelled fall in population occurs after about 2030 – with death rates reversing contemporary trends and rising from 2020 onward – the general onset of collapse first appears at about 2015 when per capita industrial output begins a sharp decline. (Turner, 2012)

So what brings about the collapse? In the Limits to Growth model there are essentially two kinds of limiting restraints. On the one hand, limitations on resource inputs (materials and energy). On the other hand, waste/pollution restraints which degrade the ecological system and human society (particularly climate change).

Turner finds that, so far it, is the former rather than the latter that is the more important. What happens is that, as resources like fossil fuels deplete, they become more expensive to extract. More industrial output has to be set aside for the extraction process and less industrial output is available for other purposes.

With signficant capital subsequently going into resource extraction, there is insufficient available to fully replace degrading capital within the industrial sector itself. Consequently, despite heightened industrial activity attempting to satisfy multiple demands from all sectors and the population, actual industrial output per capita begins to fall precipitously, from about 2015, while pollution from the industrial activity continues to grow. The reduction of inputs produced per capita. Similarly, services (e.g., health and education) are not maintained due to insufficient capital and inputs.

Diminishing per capita supply of services and food cause a rise in the death rate from about 2020 (and somewhat lower rise in the birth rate, due to reduced birth control options). The global population therefore falls, at about half a billion per decade, starting at about 2030. Following the collapse, the output of the World3 model for the standard run (figure 1 to figure 3) shows that average living standards for the aggregate population (material wealth, food and services per capita) resemble those of the early 20th century.(Turner, 2012, p. 121)


Energy Return on Energy Invested

A similar analysis has been made by Hall and Klitgaard. They argue that to run a modern society it is necessary that the energy return on energy invested must be at least 15 to 1. To understand why this should be so consider the following diagram from a lecture by Hall. (Hall, 2012)

eroei

The diagram illustrates the idea of the energy return on energy invested. For every 100 Mega Joules of energy tapped in an oil flow from a well, 10 MJ are needed to tap the well, leaving 90 MJ. A narrow measure of energy returned on energy invested at the wellhead in this example would therefore be 100 to 10 or 10 to 1.

However, to get a fuller picture we have to extend this kind of analysis. Of the net energy at the wellhead, 90 MJ, some energy has to be used to refine the oil and produce the by-products, leaving only 63 MJ.

Then, to transport the refined product to its point of use takes another 5 MJ leaving 58MJ. But of course, the infrastructure of roads and transport also requires energy for construction and maintenance before any of the refined oil can be used to power a vehicle to go from A to B. By this final stage there is only 20.5 MJ of the original 100MJ left.

We now have to take into account that depletion means that, at well heads around the world, the energy to produce energy is increasing. It takes energy to prospect for oil and gas and if the wells are smaller and more difficult to tap because, for example, they are out at sea under a huge amount of rock. Then it will take more energy to get the oil out in the first place.

So, instead of requiring 10MJ to produce the 100 MJ, let us imagine that it now takes 20 MJ. At the other end of the chain there would thus, only be 10.5MJ – a dramatic reduction in petroleum available to society.

The concept of Energy Return on Energy Invested is a ratio in physical quantities and it helps us to understand the flaw in neoclassical economic reasoning that draws on the idea of “the invisible hand” and the price mechanism. In simplistic economic thinking, markets should have no problems coping with depletion because a depleting resource will become more expensive. As its price rises, so the argument goes, the search for new sources of energy and substitutes will be incentivised while people and companies will adapt their purchases to rising prices. For example, if it is the price of energy that is rising then this will incentivise greater energy efficiency. Basta! Problem solved…

Except the problem is not solved… there are two flaws in the reasoning. Firstly, if the price of energy rises then so too does the cost of extracting energy – because energy is needed to extract energy. There will be gas and oil wells in favourable locations which are relatively cheap to tap, and the rising energy price will mean that the companies that own these wells will make a lot of money. This is what economists call “rent”. However, there will be some wells that are “marginal” because the underlying geology and location are not so favourable. If energy prices rise at these locations then rising energy prices will also put up the energy costs of production. Indeed, when the energy returned on energy invested falls as low as 1 to 1, the increase in the costs of energy inputs will cancel out any gains in revenues from higher priced energy outputs. As is clear when the EROI is less than one, energy extraction will not be profitable at any price.

Secondly, energy prices cannot in any case rise beyond a certain point without crashing the economy. The market for energy is not like the market for cans of baked beans. Energy is necessary for virtually every activity in the economy, for all production and all services. The price of energy is a big deal – energy prices going up and down have a similar significance to interest rates going up or down. There are “macro-economic” consequences for the level of activity in the economy. Thus, in the words of one analyst, Chris Skrebowski, there is a rise in the price of oil, gas and coal at which:

the cost of incremental supply exceeds the price economies can pay without destroying growth at a given point in time.(Skrebowski, 2011)

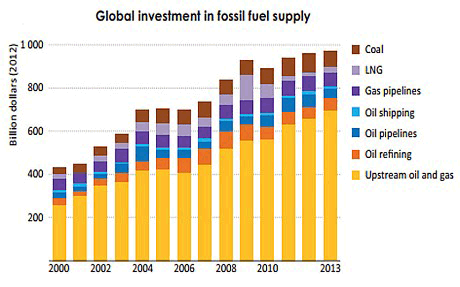
This kind of analysis has been further developed by Steven Kopits of the Douglas-Westwood consultancy. In a lecture to the Columbia University Center on Global Energy Policy in February of 2014, he explained how conventional “legacy” oil production peaked in 2005 and has not increased since. All the increase in oil production since that date has been from unconventional sources like the Alberta Tar sands, from shale oil or natural gas liquids that are a by-product of shale gas production. This is despite a massive increase in investment by the oil industry that has not yielded any increase in “conventional oil” production but has merely served to slow what would otherwise have been a faster decline.

More specifically, the total spend on upstream oil and gas exploration and production from 2005 to 2013 was $4 trillion. Of that amount, $3.5 trillion was spent on the “legacy” oil and gas system. This is a sum of money equal to the GDP of Germany. Despite all that investment in conventional oil production, it fell by 1 million barrels a day. By way of comparison, investment of $1.5 trillion between 1998 and 2005 yielded an increase in oil production of 8.6 million barrels a day.

Further to this, unfortunately for the oil industry, it has not been possible for oil prices to rise high enough to cover the increasing capital expenditure and operating costs. This is because high oil prices lead to recessionary conditions and slow or no growth in the economy. Because prices are not rising fast enough and costs are increasing, the costs of the independent oil majors are rising at 2 to 3% a year more than their revenues. Overall profitability is falling and some oil majors have had to borrow and sell assets to pay dividends. The next stage in this crisis has then been that investment projects are being cancelled – which suggests that oil production will soon begin to fall more rapidly.

The situation can be understood by reference to the nursery story of Goldilocks and the Three Bears. Goldilocks tries three kinds of porridge – some that is too hot, some that is too cold and some where the temperature is somewhere in the middle and therefore just right. The working assumption of mainstream economists is that there is an oil price that is not too high to undermine economic growth but also not too low so that the oil companies cannot cover their extraction costs – a price that is just right. The problem is that the Goldilocks situation no longer describes what is happening. Another story provides a better metaphor – that story is “Catch 22”. According to Kopits, the vast majority of the publically quoted oil majors require oil prices of over $100 a barrel to achieve positive cash flow and nearly a half need more than $120 a barrel.

But it is these oil prices that drag down the economies of the OECD economies. For several years, however, there have been some countries that have been able to afford the higher prices. The countries that have coped with the high energy prices best are the so called “emerging non OECD countries” and above all China. China has been bidding away an increasing part of the oil production and continuing to grow while higher energy prices have led to stagnation in the OECD economies. (Kopits, 2014)

Since the oil price is never “just right” it follows that it must oscillate between a price that is too high for macro-economic stability or too low to make it a paying proposition for high cost producers of oil (or gas) to invest in expanding production. In late 2014 we can see this drama at work. The faltering global economy has a lower demand for oil but OPEC, under the leadership of Saudi Arabia, have decided not to reduce oil production in order to keep oil prices from falling. On the contrary they want prices to fall. This is because they want to drive US shale oil and gas producers out of business.

The shale industry is described elsewhere in this book – suffice it here to refer to the claim of many commentators that the shale oil and gas boom in the United States is a bubble. A lot of money borrowed from Wall Street has been invested in the industry in anticipation of high profits but given the speed at which wells deplete it is doubtful whether many of the companies will be able to cover their debts. What has been possible so far has been largely because quantitative easing means capital for this industry has been made available with very low interest rates. There is a range of extraction production costs for different oil and gas wells and fields depending on the differing geology in different places. In some “sweet spots” the yield compared to cost is high but in a large number of cases the costs of production have been high and it is being said that it will be impossible to make money at the price to which oil has fallen ($65 in late 2014). This in turn could mean that companies funding their operations with junk bonds could find it difficult to service their debt. If interest rates rise the difficulty would become greater. Because the shale oil and gas sector has been so crucial to expansion in the USA then a large number of bankruptcies could have wider repercussions throughout the wider US and world economy.


Renewable Energy systems to the rescue?

Although it seems obvious that the depletion of fossil fuels can and should lead to the expansion of renewable energy systems like wind and solar power, we should beware of believing that renewable energy systems are a panacea that can rescue consumer society and its continued growth path. A very similar net energy analysis can, and ought to be done for the potential of renewable energy to match that already done for fossil fuels.

eroei-renewables

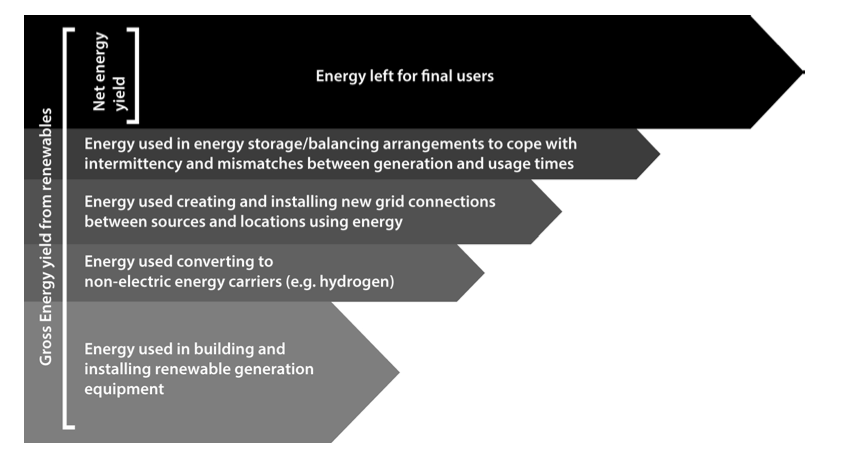
Before we get over-enthusiastic about the potential for renewable energy, we have to be aware of the need to subtract the energy costs particular to renewable energy systems from the gross energy that renewable energy systems generate. Not only must energy be used to manufacture and install the wind turbines, the solar panels and so on, but for a renewable based economy to be able to function, it must also devote energy to the creation of energy storage. This would allow for the fact that, when the wind and the sun are generating energy, is not necessarily the time when it is wanted.

Furthermore, the places where, for example, solar and wind potential are at this best – offshore for wind or in deserts without dust storms near the equator for solar – are usually a long distance from centres of use. Once again, a great deal of energy, materials and money must be spent getting the energy from where it is generated to where it will be used. For example, the “Energie Wende” (Energy Transformation) in Germany is involving huge effort, financial and energy costs, creating a transmission corridor to carry electricity from North Sea wind turbines down to Bavaria where the demand is greatest. Similarly, plans to develop concentrated solar power in North Africa for use in northern Europe which, if they ever come to anything, will require major investments in energy transmission. A further issue, connected to the requirement for energy storage, is the need for energy carriers which are not based on electricity. As before, conversions to put a current energy flux into a stored form, involve an energy cost.

Just as with fossil fuels, sources of renewable energy are of variable yield depending on local conditions: offshore wind is better than onshore for wind speed and wind reliability; there is more solar energy nearer the equator; some areas have less cloud cover; wave energy on the Atlantic coasts of the UK are much better than on other coastlines like those of the Irish Sea or North Sea. If we make a Ricardian assumption that best net yielding resources are developed first, then subsequent yields will be progressively inferior. In more conventional jargon – just as there are diminishing returns for fossil energy as fossil energy resources deplete, so there will eventually be diminishing returns for renewable energy systems. No doubt new technologies will partly buck this trend but the trend is there nonetheless. It is for reasons such as these that some energy experts are sceptical about the global potential of renewable energy to meet the energy demand of a growing economy. For example, two Australian academics at Monash University argue that world energy demand would grow to 1,000 EJ (EJ = 10 18 J) or more by 2050 if growth continued on the course of recent decades. Their analysis then looks at each renewable energy resource in turn, bearing in mind the energy costs of developing wind, solar, hydropower, biomass etc., taking into account diminishing returns, and bearing in mind too that climate change may limit the potential of renewable energy. (For example, river flow rates may change affecting hydropower). Their conclusion: “We nd that when the energy costs of energy are considered, it is unlikely that renewable energy can provide anywhere near a 1000 EJ by 2050.” (Moriarty & Honnery, 2012)

Now let’s put these insights back into a bigger picture of the future of the economy. In a presentation to the All Party Parliamentary Group on Peak Oil and Gas, Charles Hall showed a number of diagrams to express the consequences of depletion and rising energy costs of energy. I have taken just two of these diagrams here – comparing 1970 with what might be the case in 2030. (Hall C. , 2012) What they show is how the economy produces different sorts of stuff. Some of the production is consumer goods, either staples (essentials) or discretionary (luxury) goods. The rest of production is devoted to goods that are used in production i.e. investment goods in the form of machinery, equipment, buildings, roads, infrastracture and their maintenance. Some of these investment goods must take the form of energy acquisition equipment. As a society runs up against energy depletion and other problems, more and more production must go into energy acquisition, infrastructure and maintenance. Less and less is available for consumption, and particularly for discretionary consumption.

hall

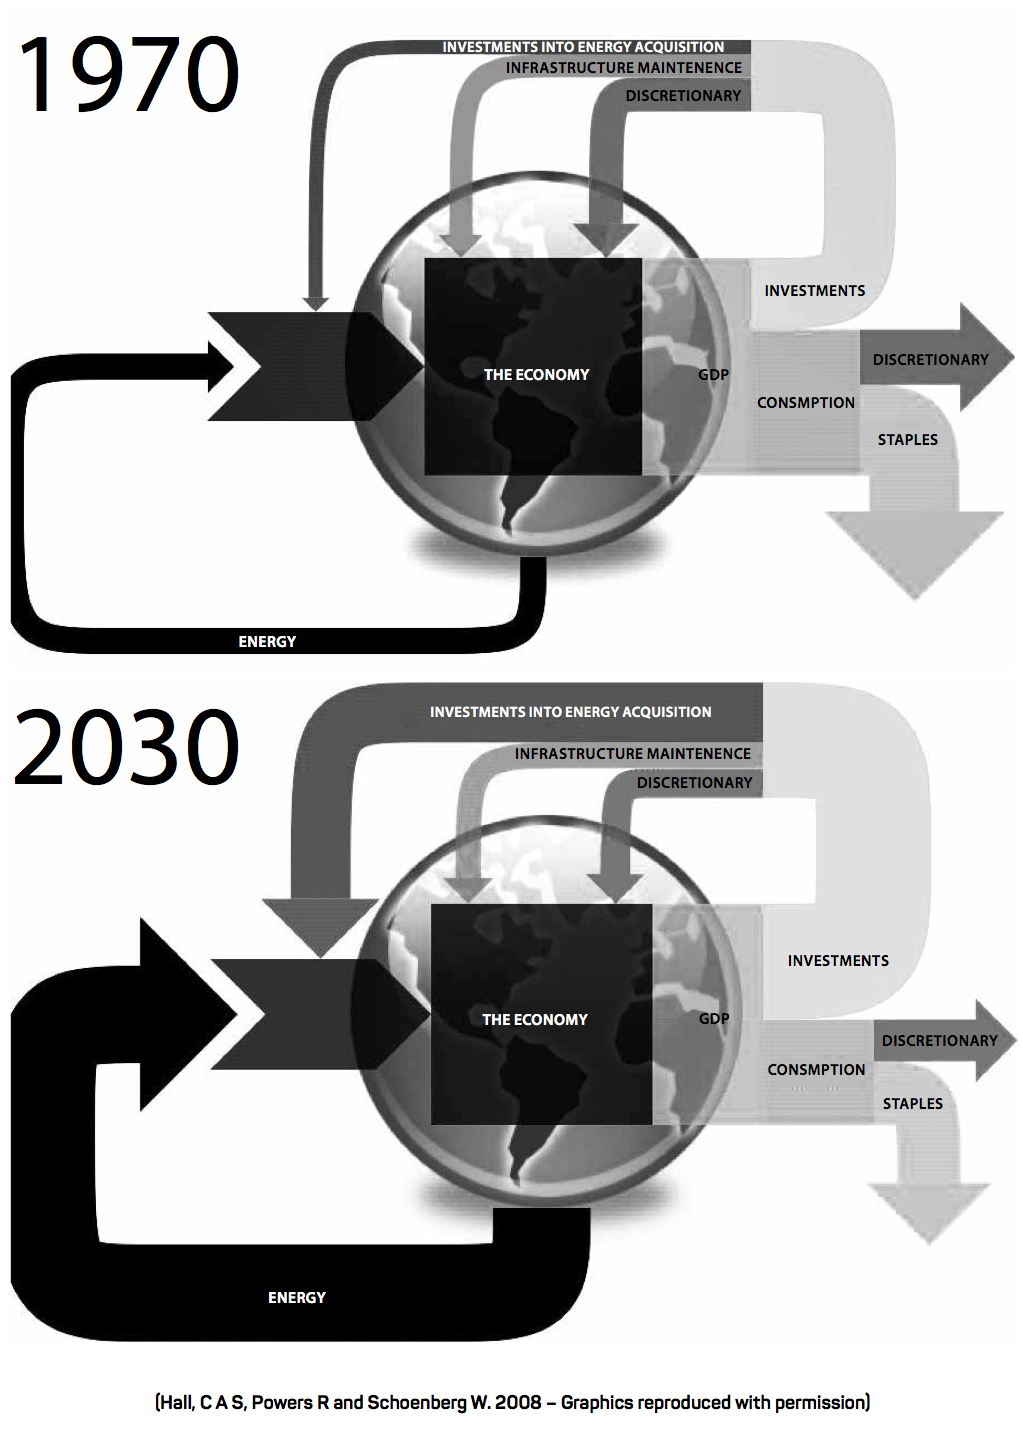
Whether the economy would evolve in this way can be questioned. As we have seen, the increasing needs of the oil and gas sector implies a transfer of resources from elsewhere through rising prices. However, the rest of the economy cannot actually pay this extra without crashing. That is what the above diagrams show – a transfer of resources from discretionary consumption to investment in energy infrastructure. But such a transfer would be crushing for the other sectors and their decline would likely drag down the whole economy.

Over the last few years, central banks have had a policy of quantitative easing to try to keep interest rates low. The economy cannot pay high energy prices AND high interest rates so, in effect, the policy has been to try to bring down interest rates as low as possible to counter the stagnation. However, this has not really created production growth, it has instead created a succession of asset price bubbles. The underlying trend continues to be one of stagnation, decline and crisis and it will get a lot worse when oil production starts to fall more rapidly as a result of investment cut backs. The severity of the recessions may be variable in different countries because competitive strength in this model goes to those countries where energy is used most efficiently and which can afford to pay somewhat higher prices for energy. Such countries are likely to do better but will not escape the general decline if they stay wedded to the conventional growth model. Whatever the variability, this is still a dead end and, at some point, people will see that entirely different ways of thinking about economy and ecology are needed – unless they get drawn into conflicts and wars over energy by psychopathic policy idiots. There is no way out of the Catch 22 within the growth economy model. That’s why degrowth is needed.

Further ideas can be extrapolated from Hall’s way of presenting the end of the road for the growth economy. The only real option as a source for extra resources to be ploughed into changing the energy sector is from what Hall calls “discretionary consumption” aka luxury consumption. It would not be possible to take from “staples” without undermining the ability of ordinary people to survive day to day. Implicit here is a social justice agenda for the post growth – post carbon economy. Transferring resources out of the luxury consumption of the rich is a necessary part of the process of finding the wherewithal for energy conservation work and for developing renewable energy resources. These will be expensive and the resources cannot come from anywhere else than out of the consumption of the rich. It should be remembered too that the problems of depletion do not just apply to fossil energy extraction coal, oil and gas) but apply across all forms of mineral extraction. All minerals are depleted by use and that means the grade or ore declines over time. Projecting the consequences into the future ought to frighten the growth enthusiasts. To take in how industrial production can hit a brick wall of steeply rising costs, consider the following graph which shows the declining quality of ore grades mined in Australia.

mining-australia

As ores deplete there is a deterioration of ore grades. That means that more rock has to be shifted and processed to refine and extract the desired raw material, requiring more energy and leaving more wastes. This is occurring in parallel to the depletion in energy sources which means that more energy has to be used to extract a given quantity of energy and therefore, in turn, to extract from a given quantity of ore. Thus, the energy requirements to extract energy are rising at the very same time as the amount of energy required to extract given quantities of minerals are rising. More energy is needed just at the time that energy is itself becoming more expensive.

Now, on top of that, add to the picture the growing demand for minerals and materials if the economy is to grow.

At least there has been a recognition and acknowledgement in recent years that environmental problems exist. The problem is now somewhat different – the problem is the incredibly naive faith that markets and technology can solve all problems and keep on going. The main criticism of the limits to growth study was the claim that problems would be anticipated in forward markets and would then be made the subject of high tech innovation. In the next chapter, the destructive effects of these innovations are examined in more depth.


Jul 102014
 
 July 10, 2014  Posted by at 2:48 pm Finance Tagged with: , , ,  17 Responses »


Gottscho-Schleisner Rockefeller Center NYC, RCA Building Sep 1 1933

As fear begins to scare the vanguard of the herd into what may develop into a rampage, the eurocrisis is back with a vengeance. Portuguese bank Esperito Santo leads the way down through missed payments, bringing the Lisbon exchange to its knees with a -4.5% plunge as I write this, with northern EU exchanges showing -1.5% losses and southern ones -2.5%. Markets start to realize than all PIIGS now have much higher state debts than before the crisis started, and that they still are very much big risks, no matter what Draghi and his never fired bazooka say. The same Draghi who, by the way, reiterated once again that Brussels should be given more – and more centralized – power. As if the May election never happened. Of course EU finances were always a mess; it’s just that now we can see it.

So, that taken care of, let’s turn to another mess: energy. Ambrose Evans-Pritchard has a nice piece out in which he labels the oil, gas and coal industry “the subprime of this cycle”. And as always, he has a lot of interesting data, and undermines them with his own analysis. It’s what he does. Still, if we simply ignore his personal views, there is plenty to “enjoy”. It’s not as if The Automatic Earth hasn’t but the energy market, especially shale, down to size sufficiently, but it’s always nice to have some new numbers, certainly when they’re absurdly large:

Fossil Industry Is The Subprime Danger Of This Cycle

The epicentre of irrational behaviour across global markets has moved to the fossil fuel complex of oil, gas and coal. This is where investors have been throwing the most good money after bad. [..] Data from Bank of America show that oil and gas investment in the US has soared to $200 billion a year. It has reached 20% of total US private fixed investment, the same share as home building.

This has never happened before in US history, even during the Second World War when oil production was a strategic imperative. The International Energy Agency (IEA) says global investment in fossil fuel supply doubled in real terms to $900 billion from 2000 to 2008 as the boom gathered pace. It has since stabilised at a very high plateau, near $950 billion last year.

All that investment looks for production that more and more vanishes beyond a receding horizon. That’s why there is so much of it: it gets more expensive, fast, to find new reserves that can actually be produced. Whether they can, if they are found at all, be produced at an economically viable level is quite another question, and one to which answers are mostly kept conveniently opaque. Big Oil is in a big bind, but oil and gas is what they do, whether it’s available or not. These companies are fighting a bitter fight just to stay alive, and given their economic and political power, that fight is sure to get very ugly.

The cumulative blitz on exploration and production over the past six years has been $5.4 trillion, yet little has come of it. Output from conventional fields peaked in 2005. Not a single large project has come on stream at a break-even cost below $80 a barrel for almost three years.

“What is shocking is that upstream costs in the oil industry have risen threefold since 2000 but output is up just 14%,” said Mark Lewis, from Kepler Cheuvreux. The damage has been masked so far as big oil companies draw down on their cheap legacy reserves. “They are having to look for oil in the deepwater fields off Africa and Brazil, or in the Arctic, where it is much more difficult. The marginal cost for many shale plays is now $85 to $90 a barrel.”

Upstream costs are up 200%, output rose just 14%. That’s just plain nasty. A few days ago we saw a report that said a joint Shell and Aramco gas project in Saudi Arabia, which cost tens of billions of dollars, came up utterly empty handed, despite the fact that the IEA claims there are trillions of cubic feet in reserves “available” there. That’s the kind of issue Big Oil runs into. And then they invest more. I think it was the Marcellus play that saw its estimates cut by 95% or so recently. Much of the industry runs on insanely optimistic estimates these days, lest nobody wants to fund their exploits any longer. You better look good than feel good.

A report by Carbon Tracker says companies are committing $1.1 trillion over the next decade to projects that require prices above $95 to break even. The Canadian tar sands mostly break even at $80-$100. Some of the Arctic and deepwater projects need $120. Several need $150. Petrobras, Statoil, Total, BP, BG, Exxon, Shell, Chevron and Repsol are together gambling $340 billion in these hostile seas.

Martijn Rats, from Morgan Stanley, says the biggest European oil groups (BP, Shell, Total, Statoil and Eni) spent $161 billion on operations and dividends last year, but generated $121 billion in cash flow. They face a $40 billion deficit even though Brent crude prices were buoyant near $100, due to disruptions in Libya, Iraq and parts of Africa. “Oil development is so expensive that many projects do not make sense,” he said.

The word “gambling” is well chosen. Thousands of billions are laid out on the crap table. Big Oil wants nothing more than rising gas prices. But western economies – plus China, Japan – would implode if prices went even “just” to $150 a barrel. The price itself would increase their profits, but the economic collapse it would cause would take those profits away again.

… the sheer scale of “stranded assets” and potential write-offs in the fossil industry raises eyebrows. IHS Global Insight said the average return on oil and gas exploration in North America has fallen to 8.6%, lower than in 2001 when oil was trading at $27 a barrel.

A large chunk of US investment is going into shale gas ventures that are either underwater or barely breaking even, victims of their own success in creating a supply glut. One chief executive acidly told the TPH Global Shale conference that the only time his shale company ever had cash-flow above zero was the day he sold it – to a gullible foreigner.

The Oxford Institute for Energy Studies says the Eagle Ford Dry Gas field, the Marcellus WC T2 and “C” Counties, Powder River, Cotton Valley, among others, are all losing money at the current Henry Hub spot price of $4.50. “The benevolence of the US capital markets cannot last forever,” it said.

In 2001, when prices were a quarter of what they are, profit margins were higher. That’s how much production costs have gone up in just 13 years. Many if not most shale plays are already losing money, kept alive by financial speculation, not energy returns. But it may take a while before people understand how that works: shale is still lauded as the big savior. Even Ambrose begs to differ:

This does not mean shale has been a failure. Optimists still hope it will reach a “positive inflexion point” in five years or so, the typical pattern for a fledgling industry. … the low-hanging fruit has been picked and the costs are ratcheting up. Three Forks McKenzie in Montana has a break-even price of $91.

Nor does it mean that America has made a mistake. Shale has been a timely shot in the arm, helping the US economy achieve “escape velocity” from the Great Recession, unlike Europe, which lurched back into a double-dip recession. It has whittled down the US current account deficit, now just 2% of GDP. Cheap gas costs – a third of EU prices and a quarter of Asian prices – has brought US industry back from near death, perhaps for long enough to give America another two decades of superpower ascendancy. But making money out of shale is another matter.

Ambrose needs to read up on depletion rates for shale wells. Shale is a financial play, not an energy source. At least, not for more than a few years. “Another two decades of superpower ascendancy” is just silly. And he himself quoted the Oxford Institute for Energy Studies, which states very clearly why that is: “The benevolence of the US capital markets cannot last forever.” Nor the benevolence of other capital markets, for that matter.

Then he turns to another issue that faces Big Oil:

Even if the fossil companies navigate the next global downturn more or less intact, they are in the untenable position of booking vast assets that can never be burned without violating global accords on climate change. The IEA says that two-thirds of their reserves become fictional if there is a binding deal limit to CO2 levels to 450 particles per million (ppm), the maximum deemed necessary to stop the planet rising more than two degrees centigrade above pre-industrial levels. It crossed the 400 ppm threshold this spring, the highest in more than 800,000 years.

“Under a global climate deal consistent with a two degrees centigrade world, we estimate that the fossil fuel industry would stand to lose $28 trillion of gross revenues over the next two decades, compared with business as usual,” said Mr Lewis. The oil industry alone would face stranded assets of $19 trillion, concentrated on deepwater fields, tar sands and shale.

Now those are numbers! Now we’re getting somewhere. Can anyone imagine Shell and ExxonMobil giving up on $1.4 trillion in revenue, year after year, for 20 years? I sure can’t. Look, Germany is supposed to be this green economy, but they’ve increased their – brown – coal use substantially recently, to make up for lost nuclear power. It’s nice to talk about ideals, Obama is increasingly chiming in, but legislating Big Oil out of existence is a whole other thing. And so is collapsing your own economy through $15 a gallon prices at the pump.

By their actions, the oil companies implicitly dismiss the solemn climate pledges of world leaders as posturing, though shareholders are starting to ask why management is sinking so much their money into projects with such political risk. This insouciance is courting fate. President Barack Obama’s new Climate Action Plan aims to cut US emissions by 30% below 2005 levels by 2030. His Clean Air Act is a drastic assault on coal-fired power plants, “industrial sabotage by regulatory means” in the words of the industry lobby.

China too is trying to break free of coal after anti-smog protests across the cities of the Eastern Seaboard. It is shutting down its coal-fired plants in Beijing this year. There is a ban on new coal plants in key regions. The Communist Party’s Five-Year Plan aims to cap demand at 3.9 billion tonnes a year up to 2015. Since the country consumes half the world’s coal supply, this has left Australia’s coal industry high and dry, Exhibit number one of assets stranded by a sudden policy change. Peak coal demand is in sight.

Sounds nice, and – almost – believable, but what are we, and our leaders, going to do when these measures raise energy prices beyond affordability? What will be our priority? Cleaner and poor, and richer and dirty? At best, we won’t know the answer to that until we’re forced to provide it; answering it today, from a position of affluence, doesn’t count. As for coal: the harder it gets to find more oil, the more attractive it will seem to switch to the most abundant fossil to keep our feet and our children warm.

In any case, staggering gains in solar power – and soon battery storage as well – threatens to undercut the oil industry with lightning speed, perhaps in a race with cheap nuclear power from a coming generation of molten salt reactors. The US National Renewable Energy Laboratory has already captured 31.1% of the sun’s energy with a solar chip, but records keep being broken. Brokers Sanford Bernstein say we are entering an era of “global energy deflation” where gains in solar technology must relentlessly erode the viability of the fossil nexus, since it goes only in one direction.

Deep sea drilling will become pointless. We can leave the Arctic alone. Once the crossover point is reached – and photovoltaic energy already competes with oil, diesel and liquefied natural gas in much of Asia without subsidies – it must surely turn into a stampede. My guess is that the world energy landscape will already look radically different in the early 2020s.

Sure, renewables are developing, but there are so many issues left to conquer that evoking an 10 year timeline for a “radically different energy landscape” looks wild. Our economies, which are very far from healthy, would need to cough up tens of trillions of dollars to build both equipment and infrastructure, and we don’t and won’t have that kind of money available; we’d need to borrow it, and add to our Andes-high pile of existing debt. The switch, if it ever happens, will take much longer, so long that it’s highly doubtful it will ever happen.

And besides, as mentioned above, who among us is going to tell Big Oil, and all of its major shareholders and highly-placed supporters in Congress and other parliaments, that they’re going to have to leave $28 trillion on the table and walk away? And what do we think their answer will be? They’re zombies, but they have a direct line into the blood of both you and the people you vote for.

it’s nice and all to think up cute little scenarios of how we’re all going to have solar panels and windmills and live in a blessed clean world, but in the real world we live in today, there are deeply entrenched economic and political power divisions and equally deeply vested interests that are not simply going to walk peacefully into the sunset and leave the world’s biggest fortune behind, just so we can do what we want. Reality is always dirtier, and in more than one way, than we like to think.

More importantly, we simply don’t have the wealth left that would allow us to make “the switch” from fossils to renewables. The plunging US markets I see now that I’m finishing this piece are just one more confirmation of that.

If Ever The Stock Market Flashed A ‘Sell’ Signal, It’s Now (MarketWatch)

I know what you’re thinking. You’re thinking: Is this market going to go up another 10%? I have no idea. But this being a powerful market that can blow your account clean off if you’re wrong, you’ve gotta ask yourself: “Do I feel lucky?” Most investors seem to feel pretty confident that this market will never go down. But if you’ve studied bear markets, you know how this story will end. Don’t forget: Human nature never changes.At the point of maximum giddiness (or pain if you’re short-selling), the market always teaches investors a costly lesson. Right now, investors are chasing yield, but all it takes is one bad day to wipe out a year’s worth of gains. Sentiment indicators such as Investors Intelligence are at historic highs (that is bearish), and the RSI Wilder indicator is telling us the market is seriously overbought.

Yes, the market can still go higher, but it’s on borrowed time. Don’t believe me? When you are standing 17,000 points in the air at the top of Dow Mountain, and the market is priced for perfection, there is nowhere to go but down. Although the market still has room to rise, so do interest rates. In fact, the odds are very good that interest rates will creep higher, and this will affect bonds and stocks. There is also an 800-pound gorilla in the room, and that is inflation. Shoppers already know that inflation is spreading. For example, cereal boxes are getting smaller while prices are rising. The price of orange juice and other commodities are skyrocketing. I could give a dozen more examples.

The Fed seems to want inflation, as if it’s desirable. Here’s what I say to the Fed: Be careful what you wish for. Here’s how the market odds look to me: At the most, the upside is 5% or 10%, while the downside is potentially 25% or 30%. I’m not saying the market is going to fall that much, but in previous bear markets that’s exactly what happened (or worse) over several months or years. Like the game of three-card monte, while most investors are celebrating the all-time highs, prudent investors are looking underneath the hood. For example, the number of stocks making new highs is shrinking every week. And the stocks that are making new highs are not leading stocks, but many unknowns. That’s a red flag.

Read more …

What else is there?

Art Cashin: ‘Ultra High’ Level Of Leverage In Stock Market (CNBC)

Big moves in a handful of stocks provided traders with a worrying signal—an “ultra-high” level of leverage in the stock market, veteran trader Art Cashin told CNBC on Wednesday. The trend could mean more volatility going forward, he added. Cashin said he saw a dozen stocks make 7% to 8% moves on Tuesday without any specific headlines to justify those swings. That left traders curious, and Cashin said they settled on high levels of leverage as a culprit behind the moves. “People must be three or four times normal leverage,” Cashin said. “We’ve seen margin accounts go up. We knew the hedge funds were playing. But to see extreme moves like that on nonspecific news tells me there’s a lot of leverage out there. … If we start to get a protracted move, it could get very volatile.”

Read more …

Over.

Buyback Plunge Another Sign Bull Market Is Nearing Its End (MarketWatch)

Here’s another sign the bull market in stocks may be nearing an end: Companies have dramatically reduced share repurchases. New stock buybacks fell to $23.2 billion in June, the lowest level in a year and a half, according to fund tracker TrimTabs Investment Research. In May, the total was just $24.8 billion, and the monthly average in 2013 was $56 billion. That’s worrisome, according to TrimTabs CEO David Santschi, because “buyback volume has a high positive correlation with stock prices.” How high? Consider the correlation coefficient, a statistic that reflects the degree to which two series tend to zig and zag in lockstep. It ranges from plus 1 (which means the two series are perfectly correlated) to minus 1 (the two move inversely to each other). A zero correlation coefficient would mean there is no detectable relationship between the two series.

According to Santschi, the correlation coefficient between monthly buyback volume and the stock market’s level, for the period from 2006 until this spring, was 0.61. That’s highly statistically significant. A high correlation also makes theoretical sense. That’s because, when a company announces a share-repurchase program, it sends a strong signal that its management really thinks its stock is undervalued — so much so that it’s willing to put its money where its mouth is. So it’s bullish for the overall market when lots of companies are simultaneously announcing such programs. To be sure, the monthly buyback data are quite volatile, so two months of anemic numbers don’t automatically doom the market. Santschi, for one, says that, if the slow pace continues through July, “we will become very concerned.”

Read more …

If borrowed money is debt, what is borrowed time called?

‘Rotten Rotation’ Signals Bull Market Living On Borrowed Time (The Tell)

Market bulls, beware.The stock market’s push to another round of record highs has hidden a “rotten rotation” that belies investor fears that the economic-growth story isn’t all it’s cracked up to be, argues Mike Ingram, market strategist at London-based BGC Brokers, in a note. Ingram highlights how bulls are now arguing that there is more equity volatility than indexes suggest. It might seem odd that bulls are actively talking up the kind of volatility that investors — often wrongly, according to Ingram — equate with increased risk. But their conclusion is always “unambiguously upbeat,” he says, with bulls arguing that markets aren’t complacent and that investors are very much engaged and placing active bets on future growth. Needless to say, Ingram isn’t convinced:

It is notable that some of the best-performing sectors in equity markets this year are highly defensive — utilities and health care — while more economically sensitive sectors such as industrials and banks have struggled. In this regard at least, markets have yet to reflect the recovery that economists have been forecasting. Indeed the consensus view that investors position themselves in more cyclically exposed names did little better than pace the market in Q1 2014 and actually underperformed in the last quarter, even in the U.S. where growth seems reasonably entrenched.

He also notes that value stocks are still struggling to outperform growth stocks, which is worrying “because one would normally expect ‘value’ to re-rate as economic growth broadens out and the premium that investors are willing to pay for growth stocks falls.” “This hasn’t really happened,” Ingram says. He observes that even after the occasional “growth scare” over the past few months, notably on the tech-heavy, and therefore growth-heavy, Nasdaq Composite, the index is still poised to challenge its 14-year-old, dot-com-era high. It’s not just equities that are flashing cautious signals, he says. Long-term bonds have defied predictions for a rout to instead rally this year.

Read more …

Fed Moves Closer to Choosing Main Stimulus-Exit Tool (Bloomberg)

Federal Reserve officials moved closer to deciding on the main tool they will use to tighten monetary policy when the time comes, most likely next year. Most participants at the Federal Open Market Committee’s June meeting agreed that the interest rate on excess reserves banks keep on deposit at the Fed “should play a central role” in the exit from extraordinary monetary stimulus, according to minutes released today in Washington. Another tool, known as the overnight reverse repurchase facility, “could play a useful supporting role,” according to the minutes. The tool could be used to set the lowest rate at which holders of cash would be willing to lend.

The Fed now pays 0.25% interest on bank reserves deposited overnight at the central bank. By contrast, it pays 0.05% on cash it borrows through its reverse repo facility, which is used by institutions such as money-market funds, which can’t deposit money at the Fed. Many members of the FOMC judged at the June meeting that “a relatively wide spread — perhaps near or above the current level of 20 basis points — would support trading in the federal funds market and provide adequate control over interest rates,” according to the minutes. A narrower spread between the two rates would give the reverse repo facility a bigger role by increasing incentives for depositors to pull cash out of banks and put it in money-market funds in search of higher interest.

Read more …

Well, now you know. Want to keep your dough in shares?

Fed Plans To End Bond Purchases In October (MarketWatch)

Federal Reserve revealed in the minutes of its June meeting released Wednesday that it has decided to end its asset-purchase program in October if the economy stays on track. According to the new plan, the Fed will make a $15 billion final reduction at its October meeting, after trimming it by $10 billion at each meeting up to that point. Fed officials said that members of the public had asked them if the Fed would end the program in October or with a final $5 billion reduction in December. Most Fed officials said that the exact end of the tapering issue will have no bearing on the timing of the first rate hike.

The Fed has said that rates would remain near zero for a “considerable time” after the Fed halts its program of bond purchases. An end of the asset purchases will “set the clock on eventual tightening — which we think could start as soon as March 2015,” said Jim O’Sullivan, chief U.S. economist at High Frequency Economics. Stocks dipped immediately after the Fed minutes were released but quickly moved higher. Bond yields also had a brief move higher after the report. The minutes also reveal that Fed officials had a lengthy discussion of its exit strategy. The central bankers generally agreed to keep reinvesting the proceeds of securities that mature on its balance sheet until after it had hiked interest rates.

Read more …

Controlled demolition.

Rate Rise Chatter Grows As Bond Yields Climb (FT)

The radar screens of investors have long been clear of the one blip guaranteed to sound the alarm for risk taking and financial complacency: interest rate rises by central banks. In the UK and US, economists and bond traders are monitoring when the long period of near zero official rates set by the Federal Reserve and the Bank of England will finally end, a moment that may matter greatly for roaring equity and credit bull markets. Since the financial crisis peaked in early 2009, investors, homeowners and companies have greatly benefited from aggressive monetary policy actions in the US and UK that have lowered the cost of borrowing and muted market volatility.

Asset prices have boomed with risk taking in stocks and credit approaching levels last seen at the height of the prior boom in 2007, as bullish sentiment has been nurtured by the easy money policies of key central banks. Such investor complacency has not escaped the attention of policy makers, with this week’s Fed meeting minutes from June raising the topic. That comes after Mark Carney, governor of the BoE, caused a stir by saying the first rate hike “could happen sooner than markets currently expect”. While central bankers, including Mr Carney, stress they are in no rush to tighten policy in the absence of real wage growth, chatter about the timing of rate increases stands to grow a lot louder should economic activity continue to pick up over the summer.

Stronger employment figures in the UK and US have already driven policy-sensitive short-dated bond yields noticeably higher in recent weeks. The two-year UK Gilt yield has led the charge, touching its highest level since the summer of 2011, while on Wednesday the US equivalent briefly eclipsed last September’s peak of 0.53%, the high water mark of last year’s interest rate rout. “There is scope for markets to be surprised should the BoE and Fed change course, that’s the nature of monetary policy,” says Paul Ashworth of Capital Economics. But unlike past rate hike periods, he says the eventual peak will be lower. “Both BoE and Fed officials have stressed that they will raise rates gradually and the neutral rate will be lower.

Read more …

Yes. They are.

Are Bond Managers Getting Antsy? (CNBC)

Markets have frustrated widespread expectations for bond yields to rise this year, but some bond managers are still antsy and are looking to protect their portfolios’ liquidity against sudden market moves. “A sudden rise in U.S. short rates could easily entice fast outflows from higher yielding bond funds,” Jan Loeys, head of global asset allocation at JPMorgan, said in a note last month. In the post-financial crisis era, tougher regulations mean banks can’t step in to take advantage of fire sales and parts of the credit market could potentially freeze up in a worst-case scenario, he said. The possibility is one that other credit managers considered. “That risk is always there,” said Harsh Agarwal, head of Asia credit research at Deutsche Bank. “With the heavy amount of supply we’ve seen so far this year, there might not be takers on the way down when things turn,” Agarwal said.

But he noted that analysts now expect interest rates won’t rise until 2015, pushing the risks further out. That hasn’t stopped some fund managers from starting to prepare the decks. JPMorgan is trimming the long exposure to bonds in its model portfolio in favor of more liquid assets, such as equities, Loeys said. It isn’t alone in worrying about the risks to bond market liquidity once interest rates begin rising. “We definitely recognize the situation,” said Jonathan Liang, senior portfolio manager for fixed income at AllianceBernstein. “We got a small taste of that last year between May and June with when people panicked.” Since then, AllianceBernstein has bolstered the liquidity management measures in its open-ended mutual funds, he said.

Read more …

Abe should be sent to Elba.

Japan Machinery Orders Fall 19.5% On Month In May (Reuters)

Japan’s core machinery orders unexpectedly fell 19.5% in May from the previous month, government data showed on Thursday, casting doubt over the outlook for a pickup in capital spending. The month-on-month decrease in core orders, a highly volatile data series regarded as an indicator of capital spending in the coming six to nine months, compared with economists’ median estimate of a 0.7% gain in a Reuters poll of economists. That followed a 9.1% fall in April, data compiled by the Cabinet Office showed. Compared with a year earlier, core orders, which exclude ships and electric power utilities, declined 14.3% in May, versus a 9.5% gain expected. The Cabinet Office cut its assessment on machinery orders, saying the increasing trend was seen stalling.

Read more …

Why trust any number coming out of Beijing?

China Trade Picture Improves, But Data Underwhelm (CNBC)

China released improved trade data that missed expectations on Thursday, figures that suggest external demand remains weak and domestic recovery fragile, analysts say. The country’s exports rose 7.2% from the year ago period, lower than the 10.6% rise predicted by a Reuters poll and after gaining 7% in May. Imports climbed an annual 5.5%, versus Reuters’ forecast for a 5.8% rise but reversing a 1.6% contraction in May. That brings trade balance to a surplus of $31.6 billion, compared with $35.92 billion logged in May. “June export growth was somewhat disappointing given that most had expected a weak base for comparison to push it into double digit territory.

That said, it remains stronger than import growth, which continues to be affected by the slowdown in the property sector,” Julian Evans-Pritchard, China economist with Capital Economics, said it a note. The Australia dollar eased following the news, while most Asian stocks gave up earlier gains while Japan’s Nikkei extended losses. China’s exports gained traction in recent months, helped by an improving U.S. economy and as the government took measures to aid exporters, including providing more tax breaks, credit insurance and currency hedging options. But imports have remained weak on sluggish demand. “We think the downside surprise in June export growth suggests a softer-than-expected pickup in China’s external demand, while the uptick in import growth points to a modest recovery in domestic demand,” said Jian Chang, analyst with Barclays.

Read more …

Did we mention China’s as corrupt as can be?

China Said to Probe Alleged Bank of China Money Laundering (Bloomberg)

China’s central bank and currency regulator are investigating a state media report that alleged Bank of China Ltd. broke rules on transferring money overseas, two government officials familiar with the matter said. The probe focuses on whether Bank of China violated regulations in its operations or aided money laundering, the people said, asking not to be named as they aren’t authorized to speak publicly on the matter. Starting an investigation doesn’t mean the Beijing-based bank has done anything wrong, they said. Bank of China, the nation’s largest foreign-exchange lender, yesterday denied a report by China Central Television claiming that it circumvented the rules by helping customers transfer unlimited amounts of yuan overseas and convert it into other currencies through a product called “Youhuitong.”

The bank said it introduced a cross-border yuan transfer service in 2011 with the knowledge of authorities. Chinese foreign-exchange rules cap the maximum amount of yuan that individuals are allowed to convert into other currencies at $50,000 each year and ban them from transferring yuan abroad directly. Policy makers have taken steps in recent years including allowing freer movements of capital in and out of China as they seek to boost the global stature of the yuan. Media reports referring to “an ‘underground bank’ and ‘money laundering’ are inconsistent with the facts,” Bank of China said in a statement on its website yesterday. The cross-border yuan transfer service only allows money to be moved for emigration and overseas property investment, it said. Youhuitong targets customers who wish to invest in or migrate to North America, Australia and some European countries, CCTV reported, referring to documents shown by unidentified Bank of China employees.

Read more …

Yay! 1000% more debt!

China Debt Seen Jumping Tenfold as Stocks Overtake Japan by 2030 (Bloomberg)

China’s corporate bond issuance will surge 10-fold by 2030 and the nation’s stock market will overtake the U.K. and Japan to become the world’s second largest, according to Credit Suisse. Bond sales in the biggest developing country will increase to $32 trillion, while the market value of stocks will jump to $54 trillion, lagging only the U.S., the Swiss bank’s research institute said in a report yesterday. Emerging markets’ share of global equity market capitalization will increase to 39% by 2030 from 22% now, the bank said. With the benchmark Shanghai Composite Index down 66% from its peak in 2007, the government has been opening up its capital markets by doubling the daily trading band of the yuan and allowing foreign investors to buy the nation’s shares through Hong Kong’s stock exchange.

China’s $9 trillion economy is already the world’s second largest behind the U.S. “The disparity between developed and emerging nations in the global capital market universe will close by 2030,” Stefano Natella, the global head of equity research at Credit Suisse in New York, said in a statement. “This should be driven by a disproportionately large contribution from emerging market equity and corporate bond supply and demand.” China’s equity market is the world’s fifth largest with a market capitalization of $3.4 trillion, according to data compiled by Bloomberg. The U.S. is the biggest at $23.5 trillion.

Read more …

Catch fire with fire.

US Uses New Tactic To Crack Laundering Cases (Reuters)

U.S. prosecutors are using a new tactic to crack down on banks that fail to fight money laundering: systematically asking suspects in a wide range of criminal cases to help them follow the money back to their bankers. The efforts are paying off in probes of banks and other financial institutions now filling the prosecution pipeline, according to Jonathan Lopez, who last month left his post as deputy chief of the Justice Department’s Money Laundering and Bank Integrity Unit (MLBIU). “Asking criminals the simple question ‘Who is moving your money?’ can lead the Department of Justice to a financial institution’s doorstep,” said Lopez, who declined to identify specific targets. The department confirmed the stepped up reliance on criminal informants in anti-money laundering investigations, but also declined to discuss probes underway.

The four-year-old MLBIU, which includes a dozen prosecutors, is responsible for insuring that financial institutions adhere to U.S. laws including the main U.S. anti-money laundering law, the Bank Secrecy Act (BSA). It has filled in an enforcement gap among federal financial regulators who lack the capacity or expertise to aggressively pursue money-laundering cases. The Justice Department has begun seeking banking information not only from perpetrators of fraud and drug traffickers, but also from suspects linked to the full range of criminal activity, said Lopez, who is now an attorney at Orrick, Herrington & Sutcliffe LLP in Washington. Many criminals seeking reduced punishment have pointed fingers at banks, casinos, money transfer businesses, check cashers, broker-dealers and other financial institutions, he said.

Read more …

Kick the loonie!

The Market Could Be Shocked By The Bank Of Canada (CNBC)

The Bank of Canada has a problem: Bank Governor Stephen Poloz was counting on a weak currency to boost exports and drive the economic recovery but things haven’t gone entirely his way. The USD/CAD started the year around 1.06, rose to about 1.12 in March and has since fallen back to around 1.06. In Q1 the CAD was the world’s worst performing major currency, with a total return of -3.5% vs USD; in Q2 it was the best performing G-10 currency, with a total return of +3.8%. The reason for the currency’s good performance is that investors became more confident about Canada’s outlook as the U.S. economy accelerated and energy prices turned up. According to the Commodity Futures Trading Commission (CFTC) Commitment of Traders report, speculators had been considerably short CAD since early 2013, but in the most recent reporting week they flipped to being a tiny bit long (about 2,700 contracts). It’s not much, but the fact that they’re no longer short is significant.

However, this could be the case of a self-destroying prophecy. Everyone knows a self-fulfilling prophecy: when all investors think something is likely to happen, for example that gold is going to go up, then they buy gold and of course it go up! A self-defeating prophecy would be the opposite: one that might go right, but since everyone acts on it, it goes wrong. That’s what I believe is going to happen here. The Canadian economy is indeed improving, but a good part of that improvement is due to exports. The latest Business Outlook Survey showed that the Canadian economy’s biggest hope remains overseas demand, particularly from the U.S. Exporters seemed notably more optimistic about the future than companies supplying the domestic market. So the Bank of Canada has to keep the currency from appreciating in order to keep the recovery going. Governor Poloz, who was previously the head of Canada’s export-promotion agency Export Development Canada, naturally understands this.

Read more …

Draghi’s a fool. Get out of the EU!

Draghi Says Brussels Needs Higher Powers as Leaders Quarrel (Bloomberg)

European Central Bank President Mario Draghi said the region needs more-centralized powers to push governments to overhaul their economies. “There is a case for some form of common governance over structural reforms,” Draghi said in a speech in London yesterday. “This is because the outcome of structural reforms, a continuously high level of productivity and competitiveness, is not merely in a country’s own interest. It is in the interest of the union as a whole.” Draghi has repeatedly said the ECB’s ultra-loose monetary policy isn’t sufficient to sustain the euro area’s fragile recovery if governments backslide.

European Union finance ministers meeting in Brussels this week signaled a willingness to give politicians extra leeway so long as they take measures to fix their economies. They then clashed as Italian Prime Minister Matteo Renzi pushed back against austerity measures. “Historical experience, for example of the International Monetary Fund, makes a convincing case that the discipline imposed by supranational bodies can make it easier to frame the debate on reforms at the national level,” Draghi said. “I would see merits in initiating, as a one-off, a new convergence process within the euro area – one which ensures that all countries are truly in a position to benefit from membership.”

Read more …

Bail in your banker’s bonus.

Germany to Force Creditors to Prop Up Struggling Banks in 2015 (WSJ)

Germany plans to force creditors into propping up struggling banks beginning in 2015, one year earlier than required under European-wide plans that set rules for failing financial institutions, according to a senior German finance ministry official.From next year, struggling bank creditors, in addition to shareholders, will have to help financial institutions, covering up to 8% of liabilities, before the banks can tap Germany’s financial markets stabilization fund SoFFin, said the official, who declined to be identified. Germany also plans to operate the SoFFin rescue fund until the end of 2015 to bridge the time until a European-wide restructuring fund is in place. The stabilization fund was scheduled to be dissolved this year. The plan comes as Europe’ banking supervisor, the European Banking Authority, conducts a new round of stress tests aimed at making the European Union’s financial sector more resilient. The results, expected for the end of October, might reveal a need for fresh capital.

Banks failing the tests have then up to six months to raise fresh capital from private investors. Bankers say that keeping SoFFin alive longer is a sign that the government wants to make sure that the country’s regional public-sector lenders, or Landesbanken, would have a last resort should the stress test unveil a capital shortfall. The move also underscores that the separate institution winding down the bad assets from former German lender Hypo Real Estate needs to continue its work. Germany’s government earlier this year halted the planned sale of Hypo Real Estate’s Dublin-based Depfa Bank unit, choosing instead to wind down the unit. Germany’s new bail-in rules are part of a package of German legislation on the European banking union, an ambitious project to centralize bank supervision in the euro zone and, when banks fail, to organize their rescue or winding-up at a European level.

Read more …

You betcha.

Mortgage Deals Leave Thousands Vulnerable If House Prices Fall (Telegraph)

A “glut” of mortgage deals aimed at buyers with small deposits pushed the number of homeowners vulnerable to a slump in property prices to a post-crisis high in June, according to the UK’s biggest chartered surveyor. The number of households that took out mortgages with deposits of 15pc or less of a property’s value rose to 10,898 in June, up from 9,750 in May and 7,166 a year ago, according to e.surv. This means that high loan-to-value (LTV) lending now accounts for one in five of all new mortgages, the highest level since April 2008. This compares with just one in nine mortgages a year ago.

The e.surv data also revealed a prominent north-south divide in high LTV lending in June. More than a quarter of borrowers in the North West and Yorkshire took out high LTV loans, compared with just 7pc in London. It said lower wages in these regions meant an increasing number of borrowers were struggling to save for a deposit. While the current levels are below those seen pre-crisis, when the number of high LTV loans reached 41,745 in February 2007 – or one in three loans – it means a growing number of households are at risk of falling into negative equity should prices fall sharply. Negative equity occurs when the size of a mortgage exceeds the price of the property it is secured against. Many homeowners were plunged into negative equity after the financial crisis because they took out high LTV mortgages only for property prices to fall in the downturn.

Read more …

Lots of economies hide unemployment rates inside “self-employment”.

Fall In UK Wages 20% Steeper Than Thought (Guardian)

Average wages in Britain have fallen further than official figures show after a huge shift into low-paid self-employment since the financial crash, according to a report by a leading thinktank. The fall in wages could be 20% greater than currently estimated across the whole workforce once Britain’s 4.5 million self-employed people are included in pay figures, said the Resolution Foundation. A real-terms fall of 10% in average wages since 2008 would increase to more than 12% if a 27% fall in self-employed incomes is taken into account. Before the Bank of England’s decision on interest rates at its monthly meeting, the thinktank said the exclusion of pay figures for the self-employed gave a skewed picture of the health of the UK’s labour market.

Officials on the Bank’s monetary policy committee, which sets interest rates, are understood to be concerned that the exclusion of self-employed incomes from official figures hampers their efforts to gauge when to increase the cost of credit. Laura Gardiner, a senior analyst at the Resolution Foundation and the author of the paper, said official figures used by the Bank and other policymakers gave “a picture that’s incomplete at best and sometimes misleading”. She said: “What we know about earnings is central to our understanding of the recovery and the timing of interest rate rises so it’s crucial that we equip ourselves with the best possible wage measure.” More than 700,000 people have declared themselves self-employed since 2008, bringing the total number of people who work for themselves to 4.5 million or one in seven of the total. Over the same period only 260,000 workers have been added to the ranks of the employed on a net basis, said the report.

Read more …

Price Of UK Electricity To Double Over Next 20 Years (Guardian)

The price of electricity could double over the next two decades, according to forecasts published on Thursday by the National Grid, the company responsible for keeping Britain’s lights on. The current price of wholesale electricity is below £50 per megawatt hour but could soar to over £100 by 2035 under a “high case” example used in the Grid’s UK Future Energy Scenarios report. The group, which is the main pipes and pylons operator in England and Wales, predicts the wholesale gas price could rise from 70p per therm to around 100p per therm under another high case scenario. The cost of electricity has already risen 20% since 2009 and the company blames future increases on the number of coal-fired power stations being closed plus the cost of subsidising wind farms.

“Electricity prices for the high case and base case scenarios are assumed to increase over the next few years due to decreasing margins as coal-fired plants retire due to the Large Combustion Plants Directive [European anti-pollution] legislation and some gas-fired plants are mothballed,” says the document. “All prices increase post-2020 as the costs of low carbon generation increasingly factor into the power price,” it adds. The Grid admits the estimates are based on the lowest “baseload” cost at which the electricity is available rather than any “peak” costs during periods of high demand. The latest forecasts – although combined with more modest price rises under different scenarios – will worry householders and energy-intensive businesses already struggling with the impact of higher bills.

Read more …

Fossil Industry Is The Subprime Danger Of This Cycle (AEP)

The epicentre of irrational behaviour across global markets has moved to the fossil fuel complex of oil, gas and coal. This is where investors have been throwing the most good money after bad. They are likely to be left holding a clutch of worthless projects as renewable technology sweeps in below radar, and the Washington-Beijing axis embraces a greener agenda. Data from Bank of America show that oil and gas investment in the US has soared to $200bn a year. It has reached 20pc of total US private fixed investment, the same share as home building. This has never happened before in US history, even during the Second World War when oil production was a strategic imperative. The International Energy Agency (IEA) says global investment in fossil fuel supply doubled in real terms to $900bn from 2000 to 2008 as the boom gathered pace. It has since stabilised at a very high plateau, near $950bn last year.

The cumulative blitz on exploration and production over the past six years has been $5.4 trillion, yet little has come of it. Output from conventional fields peaked in 2005. Not a single large project has come on stream at a break-even cost below $80 a barrel for almost three years. “What is shocking is that upstream costs in the oil industry have risen threefold since 2000 but output is up just 14pc,” said Mark Lewis, from Kepler Cheuvreux. The damage has been masked so far as big oil companies draw down on their cheap legacy reserves. “They are having to look for oil in the deepwater fields off Africa and Brazil, or in the Arctic, where it is much more difficult. The marginal cost for many shale plays is now $85 to $90 a barrel.”

Read more …

Flint is Michael Moore territory. Been a desert for ages.

After Detroit, Another City Ponders Bankruptcy (AP)

As Detroit works to emerge from bankruptcy following a court-supervised overhaul, another Michigan city with strong auto industry bonds could be on the brink of beginning the same process, the latest sign that the spate of municipal defaults may not have ended. Flint, which was the birthplace of General Motors and once had 200,000 residents, also has suffered a spectacular drop in population and factory jobs and a corresponding rise in property abandonment, much like its insolvent big brother an hour’s drive south. If a judge rules against Flint’s effort to cut its retiree health care benefits, the city is expected to join about a dozen cities or counties to seek court relief since the beginning of the recession. “If we don’t get any relief in the courts … we are headed over the same cliff as Detroit,” said Darnell Earley, the emergency manager appointed by Gov. Rick Snyder to manage Flint’s finances. “We can’t even sustain the budget we have if we have to put more money into health care” for city workers.

Before Detroit, the largest local government bankruptcy filing was in Jefferson County, Alabama in November 2011. The county emerged last year after reorganization of its $4 billion in debt. Court proceedings continue for the California cities of Stockton, San Bernardino, and Mammoth Lakes, all of which filed in 2012. The greatest threat of new cases may be in Michigan, where about a dozen cities, many of them small, and four school districts are under state control. The state unemployment rate still is 7.3%, and some entities remain saddled with underfunded pension plans. That Flint might follow Detroit, which filed in July 2013, isn’t surprising given their shared circumstances. Both once were boomtowns brimming with auto jobs for collars white and blue. General Motors employed about 80,000 in the area in the early 1970s. Fewer than 8,000 GM jobs remain. The city’s population has fallen to just below 100,000.

Read more …

Anyone surprised?

Second Silent Spring? Bird Declines Linked to Popular Pesticides (NatGeo)

Pesticides don’t just kill pests. New research out of the Netherlands provides compelling evidence linking a widely used class of insecticides to population declines across 14 species of birds. Those insecticides, called neonicotinoids, have been in the news lately due to the way they hurt bees and other pollinators. This new paper, published online Wednesday in Nature, gets at another angle of the story—the way these chemicals can indirectly affect other creatures in the ecosystem. Scientists from Radboud University in Nijmegen and the Dutch Centre for Field Ornithology and Birdlife Netherlands (SOVON) compared long-term data sets for both farmland bird populations and chemical concentrations in surface water. They found that in areas where water contained high concentrations of imidacloprid—a common neonicotinoid pesticide—bird populations tended to decline by an average of 3.5% annually.

“I think we are the first to show that this insecticide may have wide-scale, significant effects on our environment,” said Hans de Kroon, an expert on population dynamics at Radboud University and one of the authors of the paper. Pesticides and birds: If this story sounds familiar, it’s probably because Rachel Carson wrote about it back in 1962. Carson’s seminal Silent Spring was the first popular attempt to warn the world that pesticides were contributing to the “sudden silencing of the song of birds.” “I think there is a parallel, of course,” said Ruud Foppen, an ornithologist at SOVON and co-author of the Nature paper. Foppen says that while Carson battled against a totally different kind of chemicals—organophosphates like DDT—the effects he’s seeing in the field are very much the same. Plainly stated, neonicotinoids are harming biodiversity. “In this way, we can compare it to what happened decades ago,” he said. “And if you look at it from that side, we didn’t learn our lessons.”

In the past 20 years, neonicotinoids (pronounced nee-oh-NIK-uh-tin-oyds) have become the fastest growing class of pesticides. They’re extremely popular among farmers because they’re effective at killing pests and easy to apply. Instead of loading gallons and gallons of insecticide into a crop duster and spraying it over hundreds of acres, farmers can buy seeds that come preloaded with neonicotinoid coatings. Scientists refer to neonicotinoids as “systemic” pesticides because they affect the whole plant rather than a single part. As the pretreated seed grows, it incorporates the insecticide into every bud and branch, effectively turning the plant itself into a pest-killing machine.

This lock, stock, and barrel approach to crop protection means that no matter where a locust or rootworm likes to nibble—the root, the stem, the flower—the invader winds up with a bellyful of neurotoxins. “The plants become poison not only for the insects that farmers are targeting, but also for beneficial insects like bees,” said Jennifer Sass, a senior scientist with the Natural Resources Defense Council (NRDC) who’s been building a case against the widespread use of neonicotinoids. The pesticide’s top-to-bottom coverage means the plants’ flowers, pollen, and nectar are all poisonous too. Worse still, Sass says, neonicotinoids can persist in the soil for years. This gives other growing things a chance to come into contact with and absorb the chemicals.

Read more …