Arthur Rothstein Descendants of slaves on Pettway plantation, Gee’s Bend, Alabama February 1937
Tyler Durden runs a few lines by us from casino mogul Steve Wynn that paint a micro cosmos of everything that’s going wrong in our economies. Wynn calls the present conditions in which he conducts business “nirvana” because of prevailing artificially low interest rates and downward pressure on the dollar, but he also recognizes who pays for his nirvana. In very few words, he defines with precision how measures ostensibly intended to save the economy instead serve to destroy it, even as – and because -they make it – too – easy for him and his “class” to enrich themselves even further.
Steve Wynn Slams The Fed’s Ominous, Artificial Nirvana
… on one hand, as a businessman, I’m thrilled. Never dreamed that we would see anything so tasty and wonderful as that. On the other hand, it’s a reflection of questionable fiscal and monetary policy in the United States that is artificially depressed interest rates because of quantitative easing by the Fed, which is also sort of killing the value of the dollar and the living standard of the working people.
… if you’re a high-class borrower with good credit rating, this is one of the most tastiest seasons of all time for 2 reasons. You’re borrowing money at artificially depressed rates. And you’re most likely going to pay them back with 85-cent dollars. It’s a perfect storm for a businessperson unless you look at the truth of the matter and the impact it has on your customers and your employees. And that’s a much darker story. It doesn’t lend itself to a soundbite, but it’s — for every businessman in America and any economist that has their heads screwed on right, it’s an ominous situation.
Capital structure now is – these are mostly at the Venetian and the Wynn, things of beauty. They’re lovely, better than you could ever want. I mean, they’ve got everything, low interest rates, long maturities, low covenants. What else do you want? I mean, it’s great. If you look at it from our point of view. But look at it from a consumers’ point of view or a working person’s point of view, who’s paying for all this cheap money? Well, right now, the Fed is. I thought Bernie Madoff went to jail for that.”
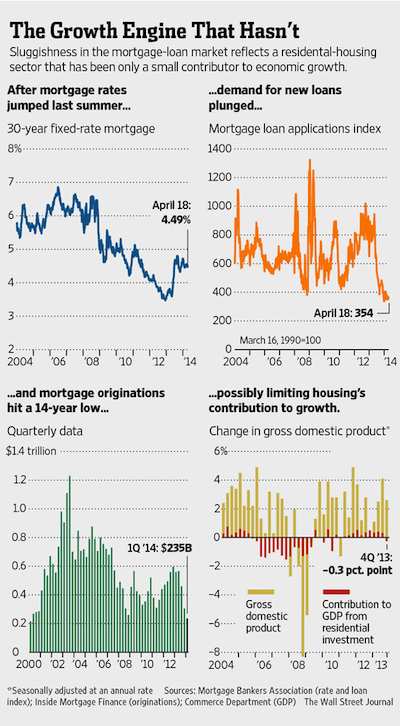
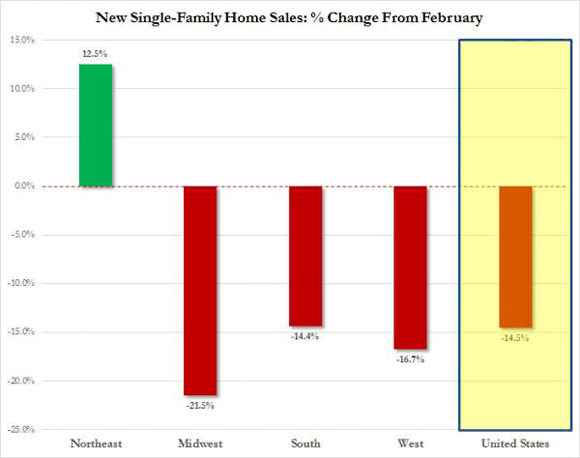
This “policy” of creating the conditions for those who have a lot of money to make a lot more is having consequences that are going to be felt deep inside American society, and for a very long time. In the US housing markets, the only properties that are still selling well are the most expensive ones. In March, sales of homes that cost over $1 million rose 7.8%, while those under $250,000 fell 12%. Since the latter are the vast majority of the market, it’s not hard to see the fall-out for the mortgage industry, construction, home stores etc.
The S&P/Case-Shiller may claim that U.S. home prices climbed 12.9% in the year through February, but that’s just one end of the market. “On the low end, home sales are still making fresh lows every single month”, broker-dealer Newedge’s Robbert van Batenburg told his clients last month. And “The American Dream is dead for everybody but the happy few who have enjoyed the tailwinds of the appreciating stock market … ”
It is not difficult to see why: The Economic Policy Institute says that from 2009 to 2013, wages rose only for the top U.S. earners, but fell for the bottom 90%. Tyler Durden quotes data analyst CoreLogic as saying: “the real estate market is the ultimate reflection of confidence, wealth and income [..] the same factors driving the income stagnation in the middle are driving the income momentum at the top.” [..] That last bit is at the core of all this, as Steve Wynn also acknowledged, even though it’s both denied and ignored across the board: it’s the same factors that serve to both make the rich richer and the poor poorer. Those factors are better known as Fed policies.
This is all not some passing phase which will simply prepare all of America, and all US citizens, for better days ahead; it’s a deciding factor in the demise of the famed American entrepreneurial spirit and the small businesses and jobs that rely on it, a segment of society that’ll be extremely hard to revive once it’s gone. More from Durden:
The Death Cross Of American Business
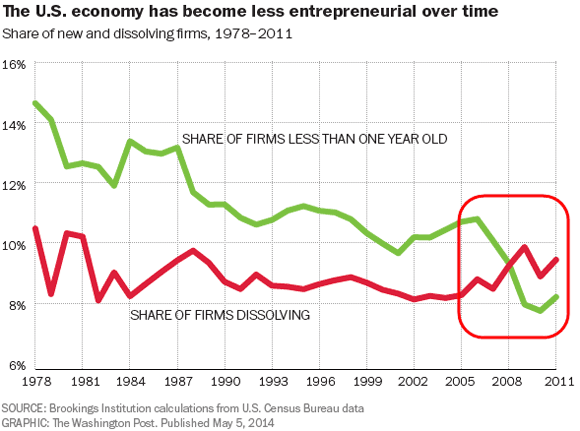
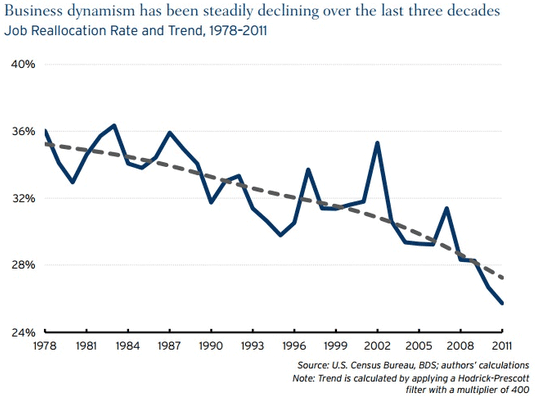
So much for the recovery… As WaPo reports, the American economy is less entrepreneurial now than at any point in the last three decades. A rather damning new Brookings Institution report shows that US businesses are being destroyed faster than they’re being created. As the authors of the report ominously explain: If the decline persists, “it implies a continuation of slow growth for the indefinite future,” as new business creation has been cut in half since 1978. This is the death cross of American Business!!
And the bottom line from Brooking’s Hathaway and Litan:
“Overall, the message here is clear. Business dynamism and entrepreneurship are experiencing a troubling secular decline in the United States. Existing research and a cursory review of broad data aggregates show that the decline in dynamism hasn’t been isolated to particular industrial sectors and firm sizes. Here we demonstrated that the decline in entrepreneurship and business dynamism has been nearly universal geographically the last three decades – reaching all fifty states and all but a few metropolitan areas.”
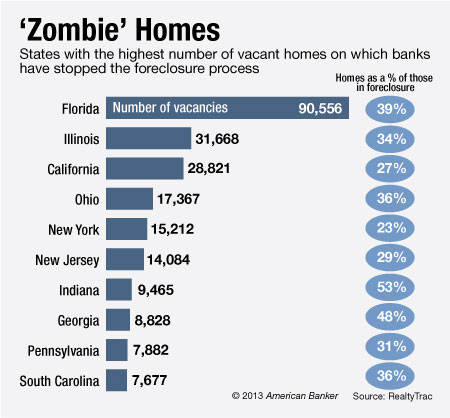
And no, nobody can prove that this is entirely the fault of Fed policies. But neither should anyone feel the need to try. Because it’s obvious that any policy aimed at facilitating the rich MUST make the poor poorer. It’s all just a transfer of money from one group to the other, a transfer hidden through mighty words of trickling growth that will lift everyone’s boat. Eternal hope and there’s always tomorrow. That’s the American dream. Well, say a prayer, because that dream has been dying for decades now, living an increasingly zombified existence fed by increasingly cheap credit that reached its zenith in lying subprime loans and the 7 million foreclosures they – so far – culminated in.
I wish I could say the American Dream has been on life support for decades, but few things are further from the truth. The Fed spent trillions of dollars, all of which use your labor as collateral, as Steve Wynn – again – rightly observes, but none of it went to re-establishing the heart of America as it once was: small business and the jobs it generates, which the US economy has always depended on, plus the home purchases those jobs made possible. Instead, Greenspan, Bernanke and now Yellen (and their made men) made sure to kill off that heart of America, for many years to come, by creating the ideal circumstances for Wynn et al to prosper even more.
That is, in the short term; Steve Wynn does seem to understand that this is all but certain to turn against him and his wealth medium and long term. Because it’s a one-on-one trade off: the Fed has not only done nothing at all to provide stimulus for the heart of America, it’s cut and dug a deadly hole in that heart in order to satisfy the bankrupt banks and bankers who are the greediest members of society. It could have, and should have, spent its stimulus in radically different ways. At least, if its goal would have been to bring recovery to America. Phoenix Capital:
The Fed Could Have Bought California & Texas With QE Money
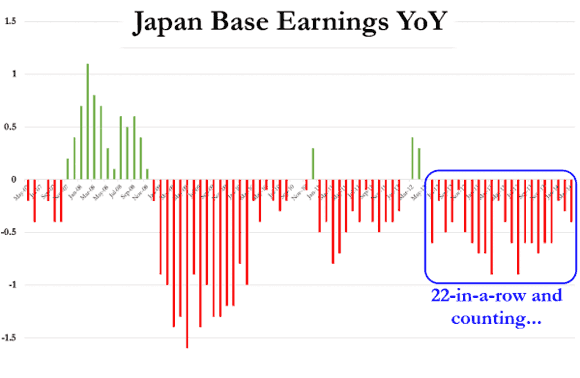
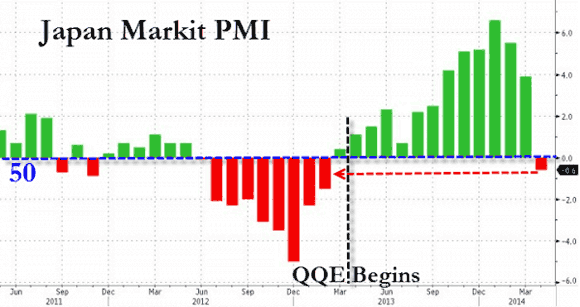
… the Fed could have spent the $3.2 trillion to create 12.8 million jobs in 2009, each paying $50K per year, and still be making payroll for them today. Obviously, that’s an absurd notion, but then again, spending $3.2 trillion on anything without any evidence that your policies are really working is absurd (job growth remains anemic with the recovery being the worst in 80+ years). Indeed, QE failed to put a dent in Japan’s jobs picture over the last 20 years. It also failed to do much for the UK. Why would it somehow be different in the US?
And no, it’s not just the Fed, and it’s not just America. All major central banks act according to the same preferences: satisfy the appetite of the greediest parties. Where they should always first have restructured bank debts, they never did more than pay lip service to that sound economic principle, and put trillion dollar lipstick on unsound pigs so history’s biggest gamblers – and, lest we forget, biggest losers – could pay their debts and sit their fat asses back down at the crap table.
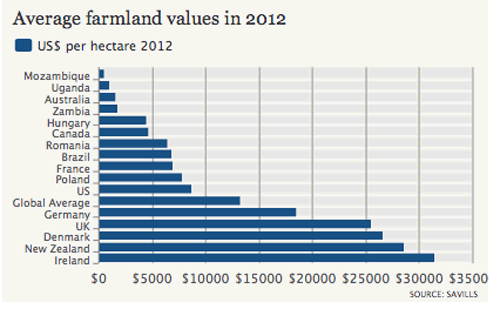
It’s a political at least as much as an economic issue. What’s best for a Wall Street banker will never be the same across the board as for a farmer in Alabama, and a German business executive’s interests will always be different from a Greek street vendor’s. In functioning democratic systems, “the people” should make sure that both get part of what they want and need. But in our present systems, not only does the less affluent party not get his “fair” part, he sees it being reduced so the already more affluent can take more. Even though, certainly in broad terms, it wasn’t the farmers and street vendors who were the cause of the crisis, but the bankers and executives.
If we don’t manage to solve that problem, and pretty soon, the US and EU won’t survive in their present shape and form, while Japan and China will be nations replete with street fighting men, armed with weapons a thousand times more efficient than history has ever witnessed. And that is truly scary. We’re not talking small problems here. Steve Wynn senses – part of – that, but he’s not sounding the big red flashing alarm he should. Here’s a metaphor: If American society were a human body, it would be under attack from a parasite, a flesh eating disease, that temporarily puts a red glow on its cheeks which makes people think it looks healthy. Flesh eating diseases kill their hosts. Consider yourselves such a host.


• The Death Cross Of American Business (Zero Hedge)
So much for the recovery… As WaPo reports, the American economy is less entrepreneurial now than at any point in the last three decades. A rather damning new Brookings Institution report shows that US businesses are being destroyed faster than they’re being created. As the authors of the report ominously explain: If the decline persists, “it implies a continuation of slow growth for the indefinite future,” as new business creation has been cut in half since 1978. This is the death cross of American Business!!
And the bottom line from Hathaway and Litan:
Overall, the message here is clear. Business dynamism and entrepreneurship are experiencing a troubling secular decline in the United States. Existing research and a cursory review of broad data aggregates show that the decline in dynamism hasn’t been isolated to particular industrial sectors and firm sizes. Here we demonstrated that the decline in entrepreneurship and business dynamism has been nearly universal geographically the last three decades – reaching all fifty states and all but a few metropolitan areas.
Doing so requires a more complete knowledge about what drives dynamism, and especially entrepreneurship, than currently exists. But it is clear that these trends fit into a larger narrative of business consolidation occurring in the U.S. economy – whatever the reason, older and larger businesses are doing better relative to younger and smaller ones. Firms and individuals appear to be more risk averse too – businesses are hanging on to cash, fewer people are launching firms, and workers are less likely to switch jobs or move.
• “The American Dream Is Dead For Everyone But A Happy Few” (Zero Hedge)
$250 Million homes in Europe, $150 Million homes in the US, and as Bloomberg notes. Million-dollar homes in the U.S. are selling at double their historical average while middle-class property demand stumbles, showing that the housing recovery is mirroring America’s wealth divide. As CoreLogic notes, “the real estate market is the ultimate reflection of confidence, wealth and income,” as purchases costing $1 million or more rose 7.8% in March, while sales of homes costing less than $250k plunged 12%, as “the same factors driving the income stagnation in the middle are driving the income momentum at the top.” The luxury markets are indeed on fire as foreign (and domestic) super-wealth floods into real estate but as NewEdge’s van Batenburg notes, echoing our very words, “The American Dream is dead for everybody but the happy few who have enjoyed the tailwinds of the appreciating stock market.”
• Q1 GDP Cut To -0.6% At Goldman, -0.8% At JPMorgan (Zero Hedge)
The US “recovery” is starting to feel more and more recessionary by the day. As we warned after we reported the trade deficit, it was only a matter of time before the Q1 GDP cuts came. And come they did, first from Barclays, and now from Goldman, which just doubled its GDP forecast loss for the past quarter from -0.3% to -0.6%. Bottom Line: The March trade deficit was roughly in line with consensus expectations, narrowing from February. However, imports were substantially higher than the Commerce Department had assumed in its initial estimate for Q1 GDP. We reduced our Q1 past-quarter tracking by three-tenths to -0.6%. Main Points:
1. The March trade deficit narrowed to $40.4bn (vs. consensus -$40.0bn), from a revised $41.9bn in February. The real petroleum balance narrowed (+$0.6bn to -$11.3bn), while the real ex-petroleum balance widened (-$0.8bn to -$42.4bn). Exports rose 2.1%, more than reversing their February decline, while imports rose 1.1%. The 10.8% increase in food & beverage imports appears to have been driven by the jump in agricultural import prices already released for the month. By country, the large drop in seasonally-adjusted exports to China which occurred in January and February stabilized in March.
2. Both imports and exports were higher than the Commerce Department assumed in their initial estimate for Q1 GDP growth. However, imports exceeded their assumption by a significantly larger margin, pushing our Q1 past-quarter GDP tracking estimate down by three-tenths to -0.6%.
Also, keep in mind that as we explained before, Q1 GDP was boosted around 1% by the forced spending “benefit” of Obamacare: a GDP contribution that will no longer be there. Which means that either normalized Q1 GDP is approaching -2%, or Q2 GDP is about to be whacked by the same amount. Pick your poison. One thing is certain – anyone hoping that 2014 is the year in which the US economy finally achieved “escape velocity” will have to drink the humiliation under the table as they repeat the mantra of apologists everywhere: “snow…. snow…. snow….” UPDATE: JPM just jumped on the bandwagon and cut Q1 GDP to -0.8% from -0.4%. Don’t worry: it snowed.
• The Fed Could Have Bought California & Texas With QE Money (Phoenix)
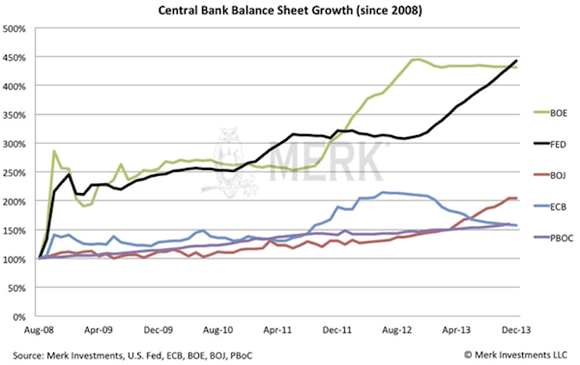
The Federal Reserve has spent over $3.2 trillion in the post-Crisis era. The bulk of this money printing has gone towards buying garbage mortgage securities or US Treasuries from Wall Street. Because we’ve reached a point in time at which $1 trillion no longer sounds like a lot of money, we thought we’d go through the exercise of assessing just what the Fed could have done with this money besides give it to Wall Street. With $3.2 trillion, the Fed could have:
- Mailed a check for $10,223 to every man, woman, and child in the US.
- Bought back all of the US debt owned by China, Japan, Belgium as well as the debt acquired via investors through the Caribbean islands.
- Bought all of France’s economy for a year (or the UK or Brazil depending on its preference) and still had $600 billion or more left over.
- Performed leveraged buyouts of California and Texas.
- Funded NASA for the next 188 years.
- Treated every person on the planet to $200 five star dinners at one of New York’s top restaurants, along with a night’s stay in the Big Apple.
- Bought every human being on earth a PlayStation 4 gaming console… and still had enough money left over to buy all of Peru and Ireland’s economies for a year.
It’s quite impressive, isn’t it? We’re repeatedly told that the Fed has to engage in QE to help the recovery and create jobs. But the facts show otherwise. The economy has added nearly 9 million jobs. But the Fed could have spent the $3.2 trillion to create 12.8 million jobs in 2009, each paying $50K per year, and still be making payroll for them today. Obviously, that’s an absurd notion, but then again, spending $3.2 trillion on anything without any evidence that your policies are really working is absurd (job growth remains anemic with the recovery being the worst in 80+ years). Indeed, QE failed to put a dent in Japan’s jobs picture over the last 20 years. It also failed to do much for the UK. Why would it somehow be different in the US?
• Steve Wynn Slams The Fed’s Ominous, Artificial Nirvana (Zero Hedge)
Steve Wynn: “we finished our financing recently; The last tranche was a $750 million bond. We sold it at 5.09% with no covenants, non-recourse to the parent. And that brought our total financing for Cotai to $3.850 billion, at an average cost of 3.3%.” “Or to put it another way, we rented the $3.85 billion for $125 million.” Now on one hand, as a businessman, I’m thrilled. Never dreamed that we would see anything so tasty and wonderful as that. On the other hand, it’s a reflection of questionable fiscal and monetary policy in the United States that is artificially depressed interest rates because of quantitative easing by the Fed, which is also sort of killing the value of the dollar and the living standard of the working people.
So the good news is, if you’re a high-class borrower with good credit rating, this is one of the most tastiest seasons of all time for 2 reasons. You’re borrowing money at artificially depressed rates. And you’re most likely going to pay them back with 85-cent dollars. It’s a perfect storm for a businessperson unless you look at the truth of the matter and the impact it has on your customers and your employees. And that’s a much darker story. It doesn’t lend itself to a soundbite, but it’s — for every businessman in America and any economist that has their heads screwed on right, it’s an ominous situation. But in terms of our moment in history, in commercial history…along with our colleagues in the industry, it’s nirvana.
Capital structure now is — these are mostly at the Venetian and the Wynn, things of beauty. They’re lovely, better than you could ever want. I mean, they’ve got everything, low interest rates, long maturities, low covenants. What else do you want? I mean, it’s great. If you look at it from our point of view. But look at it from a consumers’ point of view or a working person’s point of view, who’s paying for all this cheap money? Well, right now, the Fed is. I thought Bernie Madoff went to jail for that.”
A sign of a bad fever.
• Margin Debt Bubble Started Cracking In March Along With Momo Trades (Alhambra)
We still may not know the difference between cause and effect, but margin debt balances dropped in March for the first time in ten months. The $14 billion decline in margin debt was also coincident to an increase of $6 billion in relative cash balances in equity accounts at FINRA dealers. That meant total investor net worth improved by a little more than $20 billion. Under more normal circumstances that might be significant, and it may yet be, but it only reduces investor complacency to the extreme levels we saw just the month before. The jump in margin in February was astounding, meaning that March simply retraced only the last extreme move in a string of them.
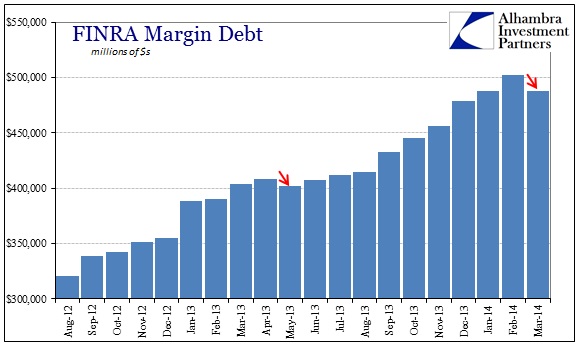
Since July 2012, margin debt balances are 56% higher. That surge in debt corresponds exactly with the spike in valuations. That includes, as I noted last week, the dramatic valuations of small cap stocks.
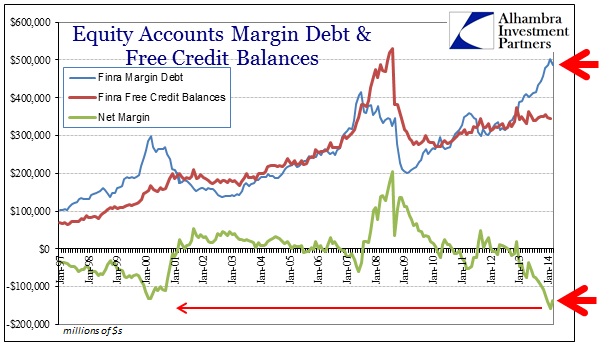
That raises the possibility that the relatively minor reversal in margin and complacency in March was in response to changes in perceptions over small cap stock valuations. It could also refer to extreme margin levels leading prices. In other words, did such stretching of investor positions lead to a decline in margin usage, thus taking the steam out of the fast rising small caps and momentums, or was an inflection in pricing and valuations the reason for the decline in margin?
• “The Six Most Important Asset Bubbles In Modern Times” (Grantham)
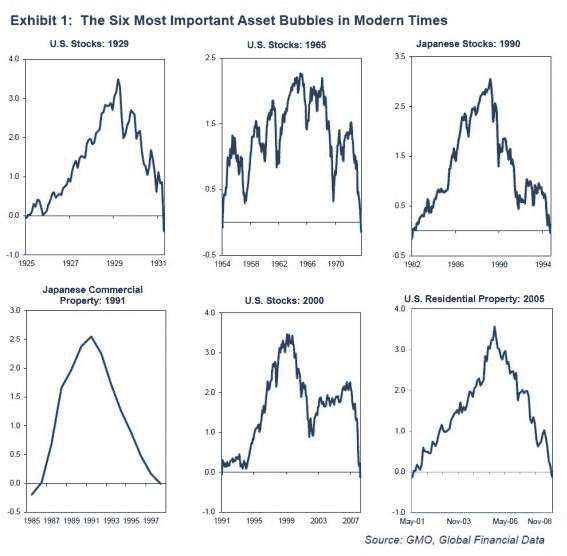
According to GMO’s Jeremy Grantham, these are the six most important asset bubbles in modern times. And some additional color from the legendary investor:
The six most important asset bubbles in modern times (in my opinion) are shown in Exhibit 1 and, as you can see, each of them qualifies on the 2-sigma definition, although the 1965-72 peak, known in the trade then as the “Nifty-Fifty” event, did so by a modest margin. This event fell short in providing the usual good examples of extreme investment craziness. Perhaps, though, the very definition of the Nifty Fifty as “one decision stocks” may have qualified it, with one extremely crazy theme substituting for many smaller ones, for “one decision stocks” were so named because you only had to make one decision: to buy. These stocks were generally believed then to be so superior that once bought they would be held for life. (Most, like Coca-Cola and Merck, stood the test of time well enough, but unfortunately several then unchallengeable examples like Eastman Kodak and Polaroid went the way of all flesh, or all film.)
There is one very important event that influenced our lives, financial and otherwise: 2008. The U.S. housing market leaped past 2-sigma all the way to 3.5-sigma (a 1 in 5,000-year event!). The U.S. equity market, though, was overshadowed by the then recent record bubble of 2000, although it still made it to a 2-sigma event on some definitions. But what was unique about 2008 was the near universality of its asset class overpricing: every equity market, almost all real estate markets (Japan and Germany abstained), and, of course, a fully-fledged bubble in oil and many other commodities.
TEXT
• Blackstone Guaranteed Huge Taxpayer Fees On Risky Pension Investments (Pando)
When you think of the term “public pension fund,” you probably imagine hyper-cautious investment strategies kept in check by no-nonsense fiduciary laws. But you probably shouldn’t. An increasing number of those pension funds are being stealthily diverted into high-fee, high-risk “alternative investments” that deliver spectacular rewards for the Wall Street firms paid to manage them – but not such great returns for pensioners and taxpayers. Citing data from the National Association of State Retirement Administrators, Al Jazeera America recently reported that “the average portion of pension dollars devoted to real estate and alternative investments has more than tripled over the last 12 years, growing from 7% to around 22% today.” [..]
The Blackstone-related documents, though, don’t just tell a story about public pensions in Kentucky. The firm, which just reported record earnings, does business with states and localities across the country. The Wall Street Journal reports that “about $37 of every $100 of Blackstone’s $111 billion investment pool comes from state and local pension plans.” In one set of documents provided by Tobe, Blackstone’s payment structure is outlined, with language guaranteeing that Blackstone will receive its hefty annual management fees from the taxpayer – regardless of the fund’s performance. In other documents, public pension money is exempted from some of the most basic protections usually guaranteed under federal law. Other contract language appears to license Blackstone to engage in financial conflicts of interests that could harm investors.
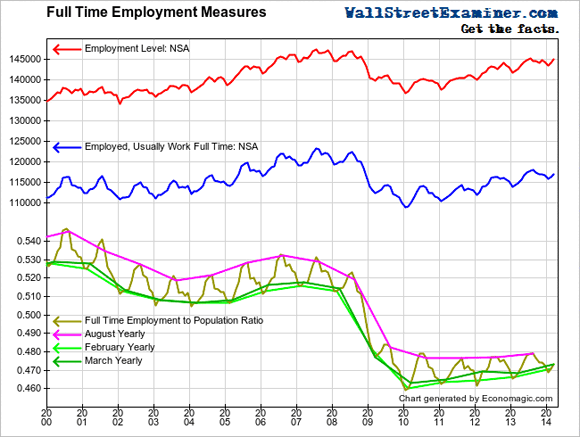
• We Are Not There Yet: Jobs Still Below Dec. 2007 Peak (Stockman)
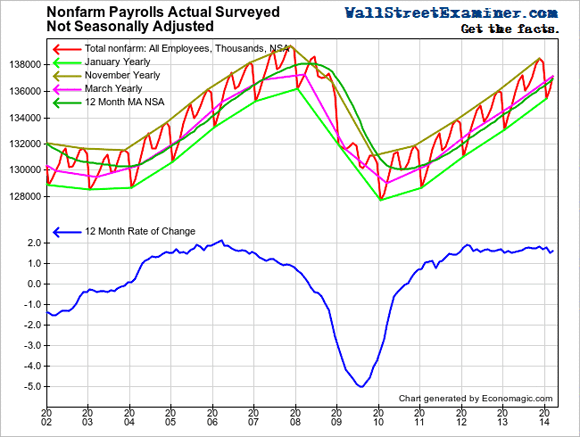
The Reagan recovery of the 1980s is not all that the legends crack it up to be, but it is a useful benchmark in the jobs counting game. It came on the heels of what was then the worst recession since the 1930s—including a significant contraction of real GDP (3%), a severe collapse of housing (50%), faltering industrial production (10%), a meltdown of commodity prices and a double-digit unemployment rate that reached 10.7%. As it happened, the economy hit its pre-recession peak in July 1981 when nonfarm payrolls printed at 91.6 million jobs (well not really, that is the repeatedly revised, reformulated and adjusted official figure for that date—-the original is buried in the BLS data morgue). Needless to say, the picture had dramatically improved 76 months later. By November 1987 the NFP payrolls were 103.4 million, meaning that the US had gained 11.8 million jobs or 13% from the prior peak.
Since we are now also 76 months out from the most recent peak, which was December 2007, it is useful to briefly review the interim cycles. Thus, after the economy peaked at 109.9 nonfarm payrolls in June 1990 the post-recession rebound was also reasonably resilient. By the 76-month marker in October 1996, nonfarm payrolls printed at 120.7 million, signifying a gain of 10.8 million jobs or 10%. Then a few years later Greenspan’s irrational exuberance turned into the thundering bust of the dotcom market, but this caused hardly a measureable dip in real GDP. In fact, the total decline—as now several times revised—-barely registers at 0.3% or less than one-tenth as severe as the Great Recession drop. So there wasn’t much of an economic hole to climb out. But rebound we did under the impetus of the second Greenspan Bubble—the great housing and credit boom of 2001-2007.
After hitting a pre-recession peak at 132.8 million jobs in February 2001, the NFP payrolls rode the credit/housing bubble to a 138.0 million print by the 76-month marker in June 2007. So this time the rebound was quite modest by historical standards, but the gain of 5.2 million new non-farm payroll jobs still amounted to a 4% advance. No such luck this time. The April NFP printed at 138.25 million—and that, alas, is still 100,000 jobs below where it was 76 months ago on the eve of the financial crisis and the subsequent Great Recession. In short, we have been in a totally new ball game—a macroeconomic cycle in which so far the monthly jobs print has consisted entirely of born again jobs, not net new jobs. [..]
…despite its grotesque violation of all prior monetary principles, the Fed went forward in the last meeting with its 64th consecutive month of zero money market rates; the BLS reported another “favorable” jobs delta; Wall Street spotted an imminent GDP acceleration just a few months down the road for the fifth time in 5 years; and the financial press reported that the polar vortex has passed and that the market could continue rising a few more points until the next crucial “Jobs Friday” i.e. next month. What delusionary babble! Among everything else, the world does not move in 30 days intervals, the path is not linear and history overwhelmingly proves that no business cycle expansion has eternal life. Indeed, we are now in month 59 of this expansion, and have therefore already overstayed our welcome—the average historical expansion having lasted only 53 months.
Ha ha ha!
• BOE May Be Forced To Raise Interest Rates To Burst Housing Bubble (Guardian)
The Bank’s hope is that lenders will get the message. If they don’t, the option is there to tighten up the capital requirements for banks and building societies. This means that lenders have to hold more capital to safeguard themselves against potential future losses, and limits the amount of money they can parcel out in mortgages. When this happens, defcon 4 becomes defcon 3. But there is plenty of cash floating around the UK financial system, courtesy of the Bank’s own quantitative easing and funding-for-lending programmes. The unleashing of several years of pent-up demand, coupled with an inadequate supply of new homes, means the property market has plenty of momentum.
Tighter capital requirements might not be sufficient, so the next step would be to tell George Osborne that it is time to wind up, or heavily scale back, his Help to Buy scheme. Telling the chancellor that his beloved mortgage subsidy plan was part of the problem rather than part of the solution would be a sign that Mark Carney, the Bank’s governor, was starting to run out of options. In Threadneedle Street, defcon 3 would have become defcon 2. By this point, the discussion inside the Bank would be about how to bring down house-price inflation with the minimum collateral damage. Rising house prices have forced many borrowers to stretch themselves to the limit.
In the past five years, the number of people taking out mortgages with a loan to income ratio of more than 4.5 has doubled to 8%. Half of all new mortgages are for more than 25 years. The Bank could impose loan to value or loan to income curbs as a way of bringing prices down. Finally, there is the nuclear option. The Bank’s financial policy committee was designed to provide a range of custom-made tools for preventing the UK housing market from running out of control. Knowledge that innocent people will be hurt means policymakers are reluctant to go to defcon 1. But ultimately, they will need to be prepared to press the button and push up the cost of borrowing.
You ain’t seen nothing yet.
• China Budget Strains Showing as S&P Warns On Local Debt (Bloomberg)
China’s cooling property market has helped push its budget into deficit and prompted Standard & Poor’s to warn of risks to the finances of regional borrowers. Growth in national fiscal revenue slowed to 5.2% in March from 8.2% in February, Ministry of Finance data showed. The budget swung to a 326 billion yuan ($52 billion) deficit from a 257.5 billion yuan surplus. New home sales in 54 cities tracked by Centaline Group slid 47% from a year earlier to a four-year low over the May 1-3 Labor Day holidays. Property market weakness would undermine Premier Li Keqiang’s efforts to spur growth and make it harder for local-government financing vehicles to repay debt using land sales.
Borrowing costs for companies with an AA rating, the most common for LGFVs, have dropped 75 basis points this year, helping spur a 40% increase in bond sales. “A significant deterioration in the property market and land prices will have very wide-ranging implications for the entire economy and also credit markets,” Christopher Lee, head of corporate ratings for Greater China at S&P in Hong Kong, said in a May 5 e-mail interview. “Land is used as the collateral for financing for LGFVs. It’s also used as the collateral for property developers to get construction funding.”
Local governments have set up thousands of financing vehicles to fund projects from subways to sewage systems, which account for 80% of state capital spending and 40% of tax revenue, the World Bank estimates. Total liabilities of regional authorities rose to a record 17.9 trillion yuan as of June 2013, the National Audit Office estimates. Land sales in 20 major cities in March fell 5% from a year earlier, the biggest drop in at least a year, according to China Real Estate Information Corp. data compiled by Bloomberg. The value of sales in third-tier cities declined 27% last month, according to Soufun Holdings Ltd., the nation’s biggest real estate website owner.
The core of China’s credit problem is that everything serves as collateral for everything else. If one pin drops ……
• China Property Slump Adds Danger to Local Finances (Bloomberg)
China’s weakening property market poses an increasing danger to local governments, threatening to strain their finances and intensify an economic slowdown. Land sales in 20 major cities fell 5% in March from a year earlier, the biggest drop in at least a year, according to China Real Estate Information Corp. data compiled by Bloomberg. The value of land sales in third-tier cities declined 27% last month, according to SouFun Holdings Ltd., the nation’s biggest real-estate website owner. Failure to find other revenue sources increases the risk of defaults and financial turmoil that curb economic expansion already projected this year at the slowest pace since 1990.
Some cities plan to reverse controls implemented to make home prices more affordable or give residency benefits to out-of-town buyers, a state-run newspaper reported this week. “As the housing market is cooling off, we expect land-sale revenue will decline and this will add pressure on the funding capacity for local governments,” said Zhu Haibin, chief China economist with JPMorgan Chase & Co. in Hong Kong. Land sales will drop more in areas where oversupply in property is more severe, said Zhu, who previously worked at the Bank for International Settlements.
The weakness adds to the urgency of expanding China’s municipal-bond market so regional governments can sell debt directly to the public instead of through off-budget corporations called local-government financing vehicles. A sample of provincial, municipal and county administrations shows they have guaranteed repayment of about 37%, or 3.5 trillion yuan ($560 billion) of debt with land sales, according to a national audit report released in December. The People’s Bank of China said yesterday it will strengthen monitoring of credit extended to LGFVs, real estate companies and industries with overcapacity to minimize risks to the financial system. The central bank will maintain a “prudent” monetary policy, according to a quarterly report.
A worsening market downturn would increase pressure on national leaders to ease monetary policy for the first time since 2012. Premier Li Keqiang and other officials have outlined plans for railway spending and tax breaks to support growth while pledging to avoid any short-term, large-scale stimulus that could exacerbate debt risks. The government budgeted for an 11.8% drop in land-sales revenue in 2014, according to the Finance Ministry’s annual work report in March. Nationwide, land sales in 2013 were equivalent to about 61% of local-government revenue, according to figures from the Ministry of Land and Resources and the Finance Ministry.
That’s just great, UK, Australia, NZ. “Healthy” property markets that you have no access to.
• Chinese Developers Rush Overseas Amid Shaky Home Market (CNBC)
As the cracks in China’s housing market deepen, the country’s major property developers are scouring the world for new opportunities. Spending on overseas residential development projects soared to $1.1 billion in the first quarter – an 80% on-year rise, with Australia, the U.K. and U.S. garnering most of the investment. Overall outbound investment – including residential and commercial – grew 25% to $2.1 billion over this period. Investment in residential projects was driven by developers looking to “counteract slower economic and price growth at home,” said David Green-Morgan, global capital markets research director at real estate services firm JLL.
Shanghai-based Greenland’s investments in London, Los Angeles and Sydney, and Guangdong-based Country Garden’s first foray in the Australian market earlier in the year, underscore growing interest in overseas residential properties. China’s once red-hot housing market has shown signs of a rapid cooling in the recent months. According to a survey by China Real Estate Index System (CREIS), 45 of the 100 cities experienced month-on-month property price declines in April, up from 37 cities in March. Meanwhile, property investment in China has also lost steam as bank funding for developers tightens. Property investment accounted for about 12% of China’s gross domestic product (GDP) in the first quarter, down from 15% in 2013, according to Reuters.
Part of today’s laugh track.
• Japan Just Needs ‘Little Turn’ By US(style) Consumer: Nomura (CNBC)
All the Japanese economy needs to take off is a small shift in U.S. consumer sentiment, according to Jeremy Bennett, chief executive of Nomura International, the Europe, Middle East and Africa wing of the Japanese bank. “We don’t need some massive U.S.(style) consumer boom. We just need a little turn in sentiment,” he told CNBC. Jeremy Bennett, CEO of Nomura International, says a return of sentiment to Japan would go “a long way” to boosting investor appetite for the country. Japan’s economy is loaded with the heaviest public debt burden in the developed world, although Prime Minister Shinzo Abe has pledged to slash debt through his “Abenomics” plan.
The economy has also been hampered by slowing growth, and is predicted to expand by 1.2% this year, below the average for developed economies, according to the Organisation for Economic Co-operation and Development (OECD). Nomura has been one of the key beneficiaries of an improved picture in Japan, although its profits fell in the first quarter of 2014, for the first time in nearly two years. “Abenomics has helped us, and internationally our investment banking business is doing well,” Bennett said. “We had a cracking year last year, in Japan and internationally.”
• Economists, Show Your Assumptions (Bloomberg)
What if I told you that jumping off a cliff is entirely safe, except for gravity? Would you find my prediction insightful or useful? Strange as it may seem, this is precisely the kind of logic that underpins many of the models that economists build to help them understand the world — and even to make policy recommendations on things such as financial regulation and inequality. It’s a serious flaw to which Stanford University finance professor Paul Pfleiderer has been trying to attract attention. As he argues in a recent paper, theorists make some pretty absurd assumptions to arrive at results or implications that are, in turn, relevant to policy.
All too often, people – including people involved in real policy matters – ignore those assumptions and end up believing ridiculous things. After all, they’ve been demonstrated in an economic model. As a spectacular example, Pfleiderer points to a 2013 working paper by two respected economists titled “Why High Leverage is Optimal for Banks,” which essentially says that banks operating with thin capital and tons of borrowed money do not necessarily present a systemic threat. They build a model demonstrating that — if you ignore a string of really important things, such as the potential for extreme leverage to destabilize the financial system and force governments into costly bailouts — you can make the case that banks should be as leveraged as possible.
A better title, Pfleiderer suggests, would be “Why ‘High’ Leverage is Optimal for Banks in an Idealized Model that Omits Many Things of First-order Importance.” There’s nothing wrong with making assumptions — even crazy ones — to help get your mind around something. The deception comes in claiming that your conclusions have real-world relevance when the assumptions are nuts. Too frequently, Pfleiderer argues, economic theories are like chameleons that change their color to suit the moment. The chameleon hides its assumptions and makes bold claims, and then, when questioned, acknowledges its assumptions and says, “Hey, I’m only a model!”
• Einhorn Finds Dinner Chat With Bernanke ‘Frightening’ (Bloomberg)
David Einhorn, manager of the $10 billion Greenlight Capital Inc., said he found a recent dinner conversation with former Federal Reserve Chairman Ben S. Bernanke scary. “I got to ask him all these questions that had been on my mind for a long time,” Einhorn said in an interview today with Erik Schatzker and Stephanie Ruhle on Bloomberg Television, referring to a March 26 dinner with Bernanke. “It was sort of frightening because the answers were not better than I thought they would be.” Einhorn has been critical of Bernanke’s willingness to leave interest rates near zero for more than five years. The hedge-fund manager has said the benefits of low rates diminish over time until they are more harmful than helpful, and that the Fed’s stimulus has led to income inequality.
Bernanke, a former Princeton University economics professor, stepped down this year after eight years helming the U.S. central bank. In describing the dinner conversation at New York’s Le Bernardin, Einhorn criticized Bernanke for saying he was 100% certain there would be no hyperinflation and that it generally occurs after a war. “Not that I think there will be hyperinflation, but how do you get to 100% certainty about anything?” Einhorn said. “Why can’t you be 99% certain?” Bernanke responded “you are wrong” to a question about the diminishing returns of having interest rates at zero, according to the hedge-fund manager. The ex-Fed chief’s explanation, Einhorn said, was that raising interest rates to benefit savers wouldn’t be the right move for the economy because it would require borrowers to pay more for capital.
Einhorn said he was keeping an “open mind” about the new Fed Chair Janet Yellen. “I would love to see if she had a better reason for rates to remain at zero at this stage of the economy,” he said. The Fed’s actions during the financial crisis have been praised by investors including billionaire Warren Buffett for helping the U.S. recover from the deepest slump since the Great Depression. Last year he described the Fed as “the greatest hedge fund in history” because of the money it’s generating for the government from its bond-buying program. “I’m not sure that is meant as a compliment,” Einhorn said in response to a question about Buffett’s remark.
Yeah, the most polluted country in the world really needs to get into shale. Great idea.
• US-China Shale Gas Rivalry Bad News For Poor Countries (CNBC)
China’s plans to establish a shale industry to rival the U.S.’s could see Beijing slash its energy imports—in a blow for some of the world’s poorest gas exporters. Shale gas is drilled out of rocks in a process known as fracking or hydraulic fracturing, and has been hailed as revolutionary way of getting cheap energy by some. However, the U.S. is currently the only country to have fully embraced fracking. Its shale gas production increased to 291.6 billion cubic meters (bcm) in 2012, up from 56.6 bcm in 2007 – a shift from 8% to 35% of the U.S.’s total natural gas production. China’s own shale gas industry is currently extremely small, but its government hopes to emulate the U.S.’s success by upping production to 6.5 bcm by 2015 and 60-to-100 bcm by 2020.
The huge increase in production will make China more economically independent, cutting its gas imports by up to 40%. But it could also a blow for several oil-exporting countries, particularly as they will be having to deal with the declining demand from the U.S. “Combined with the increase in shale gas production in the U.S., it will hit the economy of small exporters in the developing world,” said the Overseas Development Institute, a leading U.K. think tank on development issues, in a report out on Wednesday. The institute noted that developing countries had already lost around $1.5 billion in gas export revenue due to U.S. shale gas production. It named Angola and the Republic of the Congo as particularly susceptible to a fall-off in Chinese demand for their gas, and forecast each would suffer a 13% hit to national income.
Maybe they know something others don’t?!
• Exxon And Chevron Trailing In US Fracking Boom (USA Today)
What boom? While the United States enjoys a surge in oil and natural gas production, its two largest oil companies — Exxon Mobil and Chevron — have so far missed the party. Big Oil was slow to jump into the fracking business, which has transformed U.S. energy markets by extracting oil and gas from shale deposits. And its latest quarterly reports show how it’s struggling to get on board. “The big oil companies were late to invest in shale. They’re trying to play catch-up,” says Brian Youngberg, an analyst at Edward Jones, noting smaller and more nimble companies got into fracking more quickly. He says the multinationals are now investing in new shale developments, but since they’re so big, it’s difficult for any single project to shift their overall bottom line.
The nation’s energy boom is largely due to the combined use of horizontal drilling and hydraulic fracturing, or fracking, which has made it cheaper to break apart shale rock and extract oil or gas trapped deep underground. Since 2005, U.S. production has risen 35% for natural gas and 44% for crude oil, according to the U.S. Energy Information Administration. The major oil companies, which have invested heavily in mega projects offshore and abroad, report a different story. Exxon, the nation’s largest oil company, said Thursday that it produced 5% less natural gas in the United States during the first three months of 2014 than it did in the same period a year ago. Its domestic production of crude oil and other liquids rose 1.6%.
Chevron, the second-largest U.S. oil company, reported declining production. On Friday, it said it produced 4% less oil and 3% less natural gas in the United States during 2014’s first quarter than it did a year ago. Only the third-largest U.S. oil company, ConocoPhillips, did slightly better. On Thursday, it reported a U.S. production uptick of 2.4% for crude oil and 1.8% for natural gas in the first three months of 2104, compared with the same period last year.
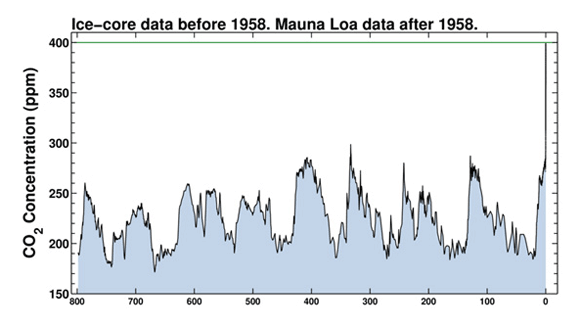
Time to wonder if enough people will care enough soon enough. Doesn’t look like it. Looks like we’re too busy drilling in the ever scarcer remaining pristine locations we haven’t yet exploited, and too busy preparing to go to war over access to the very resources that lifted us all the way up over 400ppm in what’s really no more than the blink of an eye in the 800,000 year timeframe.
• First time in 800,000 years: April’s CO2 levels above 400 ppm (CBS)
Less than a year after scientists first warned that the amount of carbon dioxide in the atmosphere could rise above 400 parts per million and stay there, it has finally happened. For the first time in recorded history, the average level of CO2 has topped 400 ppm for an entire month. The high levels of carbon dioxide is largely considered by scientists a key factor in global warming, according to the National Oceanic and Atmospheric Administration’s (NOAA) Earth System Research Lab. The Scripps Institution of Oceanography, a part of the University of California, San Diego, reported that April’s average amount of CO2 was 401.33 ppm, with each day reading above 400 ppm.
Scientists, using the Keeling Curve, show the increase of CO2 levels over the course of 800,000 years. Scripps Institution Of OceanographyAccording to the Institute, CO2 levels have not surpassed 300 ppm in 800,000 years. It is estimated that during Earth’s ice ages, the C02 levels were around 200 ppm, with warmer periods — as well as prior to the Industrial Revolution — having carbon dioxide levels of 280 ppm. Past levels of CO2 are found in old air samples preserved as bubbles in the Atlantic ice sheet, according to Scripps. Throughout the year, there are changes in CO2 levels that occur naturally from the growth of plants and trees. Carbon dioxide levels often peak in the spring due to plant growth, and decrease in the fall when plants die, according to NOAA. However, human CO2 production has exacerbated the effects, causing global warming and climate change.
Scientists have been measuring the levels of carbon dioxide over the past fifty years. Since 1958, the Keeling Curve — named after developer Charles Keeling — has been used to monitor the levels of greenhouse gasses atop Hawaii’s Mauna Loa. When Keeling first started monitoring CO2 levels, the amount of carbon dioxide present in the atmosphere was 313 ppm. After Keeling’s death in 2005, his son Ralph, a professor of geochemistry and director of the Scripps CO2 Program, continued the measurements. In a statement last year, he warned that CO2 levels would “hit 450-ppm within a few decades.”
Make that the whole population.
• Half U.S. Population Vulnerable to Climate Change (Bloomberg)
More than half the U.S. population lives in coastal areas that are “increasingly vulnerable” to the effects of climate change, which will ripple throughout the U.S. economy, a White House advisory group’s report concluded. The report released today said the impact of the accumulation of greenhouse gases in the atmosphere is already affecting Americans, with coastal flooding, heavier downpours and more intense wildfire episodes. And more changes are coming. “The real bottom line is that climate change is not a distant threat,” John Holdren, the White House science adviser, told reporters today. “It’s already affecting different regions in the country.”
The findings may bolster President Barack Obama’s energy and environmental agenda, which he is pursuing without legislation from Congress, as well as his proposals to prepare the U.S. to deal with global warming. The administration is focusing on climate change policies this week in conjunction with the release of the report, said John Podesta, an Obama adviser who’s overseeing the president’s climate plans. The warming climate will affect broad sectors of the economy, from infrastructure along the densely populated corridor from Washington to New York to Boston, to crops in the Midwest farm belt to water supplies in growing cities of the Southwest, the authors concluded.
Republicans such as Senators John Barrasso of Wyoming and Jim Inhofe of Oklahoma said the administration is using climate change to support new regulations they say would eliminate jobs. “The president is attempting to once again distract Americans from his unchecked regulatory agenda that is costing our nation millions of job opportunities and our ability to be energy independent,” Inhofe said in an e-mail statement.