
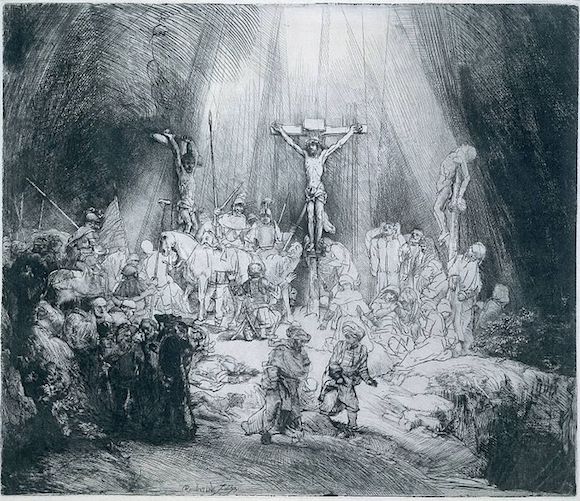
Rembrandt van Rijn The Three Crosses 1653
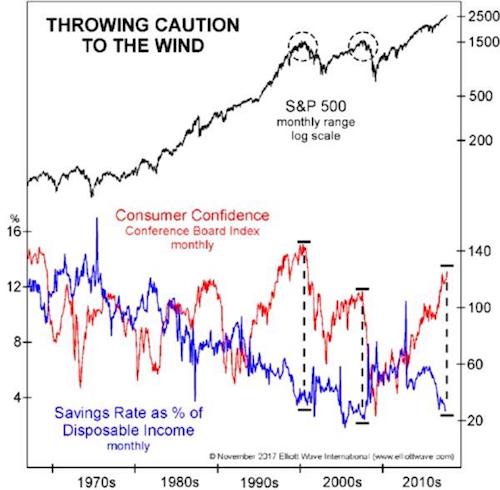
John Rubino recently posted a graph from Bob Prechter’s Elliot Wave that points to some ominous signs. It depicts the S&P 500, combined with consumer confidence and savings rate. As the accompanying video at Elliott Wave, What “Too Confident to Save” Means for Stocks, shows, when the gap between high confidence and low savings is at its widest, a market crash -often- follows.
In 2000, the subsequent crash was 39%, in 2007 it was 54%. We are now again witnessing just such a gap, with the S&P 500 at record levels. Here’s the graph, with John’s comments:
Consumers Are Both Confident And Broke
Elliott Wave International recently put together a chart that illustrates a recurring theme of financial bubbles: When good times have gone on for a sufficiently long time, people forget that it can be any other way and start behaving as if they’re bulletproof. They stop saving, for instance, because they’ll always have their job and their stocks will always go up. Then comes the inevitable bust. On the following chart, this delusion and its aftermath are represented by the gap between consumer confidence (our sense of how good the next year is likely to be) and the saving rate (the portion of each paycheck we keep for a rainy day). The bigger the gap the less realistic we are and the more likely to pay dearly for our hubris.
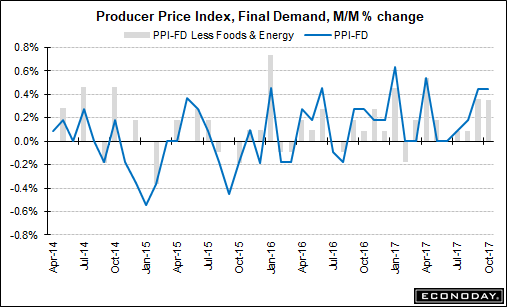
John is mostly right. But not entirely. Not that I don’t think he knows, he simply forgets to mention it. What I mean is his suggestion that people stop saving because they’re confident, bullish. To understand where and why he slightly misses, let’s turn to Lance Roberts. Before we get to the savings, Lance explains why the difference between the Producer Price Index (PPI) and Consumer Price Index (CPI) is important to note.
Summarized, producer prices are rising, but consumer prices are not.
There is an important picture that is currently developing which, if it continues, will impact earnings and ultimately the stock market. Let’s take a look at some interesting economic numbers out this past week. On Tuesday, we saw the release of the Producer Price Index (PPI) which ROSE 0.4% for the month following a similar rise of 0.4% last month. This surge in prices was NOT surprising given the recent devastation from 3-hurricanes and massive wildfires in California which led to a temporary surge in demand for products and services.
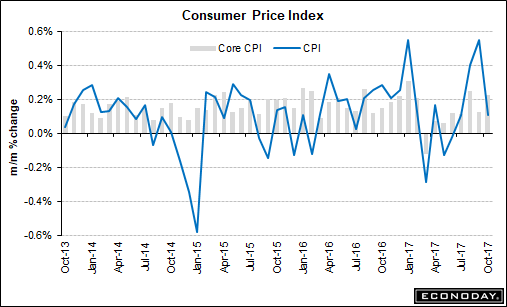
Then on Wednesday, the Consumer Price Index (CPI) was released which showed only a small 0.1% increase falling sharply from the 0.5% increase last month.
Such differences have real life consequences. In Lance’s words:
This deflationary pressure further showed up on Thursday with a -0.3% decline in Export prices. (Exports make up about 40% of corporate profits) For all of you that continue to insist this is an “earnings-driven market,” you should pay very close attention to those three data points above. When companies have higher input costs in their production they have two choices: 1) “pass along” those price increase to their customers; or 2) absorb those costs internally.
If a company opts to “pass along” those costs then we should have seen CPI rise more strongly. Since that didn’t happen, it suggests companies are unable to “pass along” those costs which means a reduction in earnings. The other BIG report released on Wednesday tells you WHY companies have been unable to “pass along” those increased costs.
The “retail sales” report came in at just a 0.1% increase for the month. After a large jump in retail sales last month, as was expected following the hurricanes, there should have been some subsequent follow through last month. There simply wasn’t. More importantly, despite annual hopes by the National Retail Federation of surging holiday spending which is consistently over-estimated, the recent surge in consumer debt without a subsequent increase in consumer spending shows the financial distress faced by a vast majority of consumers.
That already hints at what I said above about savings. But it’s Lance’s next graph, versions of which he uses regularly, that makes it even more obvious. (NOTE: I think he means to say 2009, not 2000 below)
The first chart below shows a record gap between the standard cost of living and the debt required to finance that cost of living. Prior to 2000(?!), debt was able to support a rising standard of living, which is no longer the case currently.
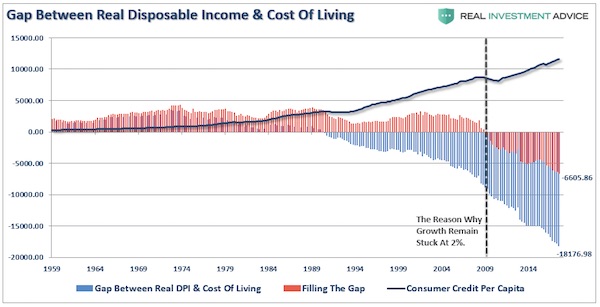
The cut-off point is 2009, unless I miss something in Lance’s comment. Before that, borrowing could create the illusion of a rising standard of living. Those days are gone. And it’s very hard to see, when you take a good look, what could make them come back.
Not only are savings not down because people are too confident to save, they are down because people simply don’t have anything left to save. The American consumer is sliding ever deeper into debt. And as for the Holiday Season, we can confidently -there’s that word again- predict that spending will be disappointing, and that much of what is still spent will add to increasing Consumer Credit Per Capita, as well as the Gap Between Real Disposable Income (DPI) And Cost Of Living.
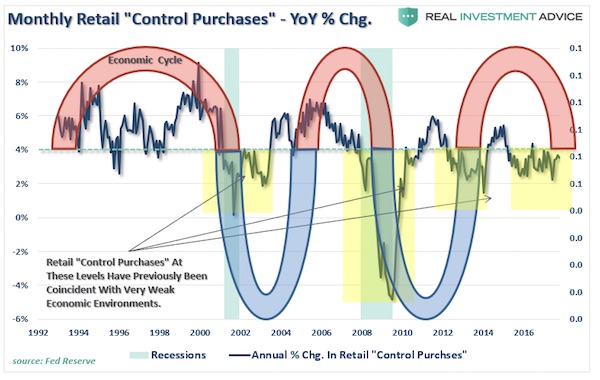
The last graph, which shows Control Purchases, i.e. what people buy most, a large part of which will be basic needs, makes this even more clear.
With a current shortfall of $18,176 between the standard of living and real disposable incomes, debt is only able to cover about 2/3rds of the difference with a net shortfall of $6,605. This explains the reason why “control purchases” by individuals (those items individuals buy most often) is running at levels more normally consistent with recessions rather than economic expansions.
If companies are unable to pass along rising production costs to consumers, export prices are falling and consumer demand remains weak, be warned of continued weakness in earnings reports in the months ahead. As I stated earlier this year, the recovery in earnings this year was solely a function of the recovering energy sector due to higher oil prices. With that tailwind now firmly behind us, the risk to earnings in the year ahead is dangerous to a market basing its current “overvaluation” on the “strong earnings” story.
“Prior to 2009, debt was able to support a rising standard of living..” Less than a decade later, it can’t even maintain the status quo. That’s what you call a breaking point.
To put that in numbers, there’s a current shortfall of $18,176 between the standard of living and real disposable incomes. In other words, no matter how much people are borrowing, their standard of living is in decline.
Something else we can glean from the graphs is that after the Great Recession (or GFC) of 2008-9, the economy never recovered. The S&P may have, and the banks are back to profitable ways and big bonuses, but that has nothing to do with real Americans in their own real economy. 2009 was a turning point and the crisis never looked back.
Are the American people actually paying for the so-called recovery? One might be inclined to say so. There is no recovery, there’s whatever the opposite of that is, terminal decline?!. It’s just, where does that consumer confidence level come from? Is that the media? Is The Conference Board pulling our leg? Is it that people think things cannot possibly get worse?
What is by now crystal clear is that Americans don’t choose to not save, they have nothing left to save. And that will have its own nasty consequences down the road. Let’s raise some rates, shall we? And see what happens?!
One consolation: Europe, Japan, China are in the same debt-driven decline that Americans are. We’re all going down together. Or rather, the question is who’s going to go first. That is the only hard call left. America’s a prime candidate.
