

Juan Gris Grapes 1913

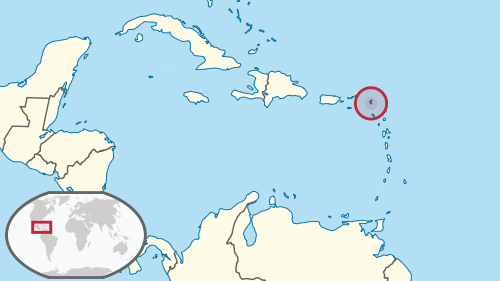
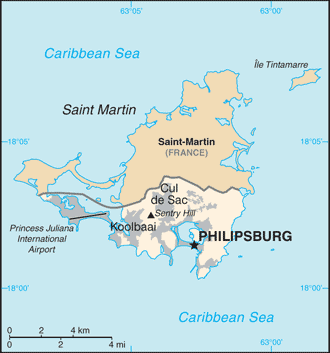
They could see Irma coming a week ahead. And nobody thought of storing extra food and water on the island? And police or soldiers? There are 70,000 people living on the combined St. Martin/St. Maarten island, and there were 6,000 American tourists alone -plus many others. St. Maarten has a ‘status aparte’ in the Dutch Kingdom: it’s self-governing. So much so, though, that no help can arrive until the Governor has explicitly asked for it. But all communication had broken down for days… Smart cookies.
• People ‘Fighting In The Streets’ For Last Remaining Food In Caribbean (Ind.)
At dawn in St. Martin, people began to gather, quietly planning for survival after Hurricane Irma. They started with the grocery stores, scavenging what they needed for sustenance: water, crackers, fruit. But by nightfall on Thursday, what had been a search for food took a more menacing turn, as groups of looters, some of them armed, swooped in and took whatever of value was left: electronics, appliances and vehicles. “All the food is gone now,” Jacques Charbonnier, a 63-year-old resident of St. Martin, said in an interview on Sunday. “People are fighting in the streets for what is left.” In the few, long days since the storm Irma pummelled the north east Caribbean, killing more than two dozen people and levelling 90% of the buildings on some islands, the social fabric has begun to fray in some of the hardest-hit communities.
Residents of St. Martin, and elsewhere in the region, spoke about a general disintegration of law and order as survivors struggled in the face of severe food and water shortages, and the absence of electricity and phone service. As reports of increasing desperation continued to emerge from the region over the weekend, governments in Britain, France and the Netherlands, which oversee territories in the region, stepped up their response. They defended themselves against criticism that their reaction had been too slow, and insufficient. Both the French and Dutch governments said they were sending in extra troops to restore order, along with the aid that was being airlifted into the region. After an emergency meeting with his government on Sunday, President Emmanuel Macron of France said he would travel on Tuesday to St. Martin, an overseas French territory.
Macron also announced late on Saturday that he would double France’s troop deployment to the region, to 2,200 from 1,100; officials say the increase is in part a response to the mayhem on St. Martin. St. Maarten, the Dutch territorial side of the island, which uses a different spelling, has also experienced widespread looting of shops, though the problem was reported to have subsided by Sunday, though not completely. “There was some looting in the first few days, but the Dutch marines and police are on the street to prevent it,” Paul De Windt, publisher of The Daily Herald, a newspaper in St. Maarten, said Sunday. “Some people steal luxury things and booze, but a lot of people are stealing water and biscuits.”
The Bermuda High.
• 20 Miles Made A $150 Billion Difference In Hurricane Irma’s Damage Bill (BBG)
Twenty miles may have made a $150 billion difference. Estimates for the damage Hurricane Irma would inflict on Florida kept mounting as it made its devastating sweep across the Caribbean. It was poised to be the costliest U.S. storm on record. Then something called the Bermuda High intervened and tripped it up. “We got very lucky,” said Jeff Masters, co-founder of Weather Underground in Ann Arbor, Michigan. If Irma had passed 20 miles west of Marco Island instead of striking it on Sunday, “the damage would have been astronomical.” By one estimate, the total cost dropped to about $50 billion Monday from $200 billion over the weekend. The state escaped the worst because Irma’s powerful eye shifted westward, away from the biggest population center of sprawling Miami-Dade County.
The credit goes to the Bermuda High, which acts like a sort of traffic cop for the tropical North Atlantic Ocean. The circular system hovering over Bermuda jostled Irma onto northern Cuba Saturday, where being over land sapped it of some power, and then around the tip of the Florida peninsula, cutting down on storm surge damage on both coasts of the state. “The Bermuda High is finite and it has an edge, which was right over Key West,” Masters said. Irma caught the edge and turned north. For 10 days, computer-forecast models had struggled with how the high was going to push Irma around and when it was going to stop, said Peter Sousounis, director of meteorology at AIR Worldwide. “I have never watched a forecast more carefully than Irma. I was very surprised not by how one model was going back and forth – but by how all the models were going back and forth.”
For 10 days, computer-forecast models had struggled with how the high was going to push Irma around and when it was going to stop, said Peter Sousounis, director of meteorology at AIR Worldwide. “I have never watched a forecast more carefully than Irma. I was very surprised not by how one model was going back and forth – but by how all the models were going back and forth.” “With Irma, little wobbles made a huge difference,”said Chuck Watson, a disaster modeler with Enki Research in Savannah, Georgia. With a tightly-wound storm like Andrew coming straight into the state, “a 30-mile wobble isn’t going to matter.” Still, when it comes to damage, “Irma may bump Andrew,” Watson said. The company’s most recent estimate is for $49.5 billion in Irma costs for Florida; Andrew’s were an inflation-adjusted $47.8 billion.
Too many voices blaming Irma on climate change. Don’t make claims you can’t prove, it doesn’t help. Our former Oil Drum co-collaborator Robert Rapier takes a careful approach.
• The Role Of Climate Change In Extreme Weather Events (Rapier)
First, is the climate changing? Almost everyone would agree that this is the case. What some would dispute is whether human activity is a significant contributor. I accept that it is, but I won’t attempt to make that case here. If you don’t accept that human activity is impacting the climate, I won’t be able to convince you in a short article here. But let’s agree that the climate is changing. There are multiple lines of evidence that indicate that the earth is warming. One piece of evidence is that the surface temperature of the oceans is climbing. NOAA (National Oceanic and Atmospheric Administration) has determined that since 1880, the average global surface temperature of the ocean has increased by about 1 degree Fahrenheit (°F). Relative to the average temperature from 1971 to 2000, the surface temperature over the past five years has risen about 0.5°F.
These measurements aren’t controversial, as they have been confirmed by many different studies. But the temperature change varies depending on where it is measured. For example off the coast of Greenland, the surface temperature has actually declined by about 1°F. But according to data from NOAA and IPCC (Intergovernmental Panel on Climate Change), across much of the Atlantic and Pacific Oceans, the surface temperature has risen 1.5°F-2.0°F since 1900. Again, you might dispute the reason, but there is really no disputing the measurements (other than perhaps the magnitude of the increase). There are some effects we can expect from a warmer ocean surface. I will discuss two, that are based on physics. Warmer water will lead to greater evaporation, which should show up as higher humidity in the atmosphere.
That has been observed, although as with the ocean surface temperature, some areas have seen humidity decline. The net effect is that more water vapor in the air means more rainfall on average. This helps explain why Houston, for example, could experience three “500-year” flood events in three years. Since there’s more water in the atmosphere, the probability of these heavy rainfall events has increased. In other words, they aren’t really “500-year” floods anymore. Normal has shifted. Some areas are going to experience more rain and some less, but on average precipitation is on the rise. The other impact of warmer ocean surfaces is stronger hurricanes. Hurricanes (as well as typhoons and cyclones elsewhere in the world) are massive heat engines that convert warm water into strong winds.
Hurricanes are fueled by warm seawater, which is why you see them dissipate when they move over land, or into cooler ocean waters. Thus, it would be expected that we would see stronger storms as a result of warmer ocean surfaces. That was certainly the case with Hurricane Irma, which set a record with top winds of 185 miles per hour (mph) for 37 hours. While some are quick to blame climate change any time there is an extreme weather event, these events have been taking place throughout history. It is wrong to blame any particular event on climate change, but the physics of why we can expect some of these events to become more extreme is well understood – even if some still reject that human activity is driving it.
Great piece: “America is a delusion, the grandest one of all”
In Capitalism: A Ghost Story, 2015, Arundhati Roy writes, “the middle class in India live side-by-side with spirits of the nether world, the poltergeist of dead rivers, dry wells, bald mountains and denuded forests; the ghosts of 250,000 debt ridden farmers who have killed themselves, and of the 800 million who have been impoverished and dispossessed to make way for them”. Is it any different in the good ol’ U.S. of A? Other than clarifying class-calibration whereby India’s emergent middle class can be equated with America’s mostly white ten-percenters, or upper-class, I suspect not. Indeed, as the precipitated waters of the gulf coast inundate the sunken oil and chemical lands of Texas and Louisiana, we are experiencing our own sub-continental, Bangladeshi nightmare.
The spirits of dead dinosaurs have arisen to re-arrange geographies and elide the physical certainties that used to exist between solid and liquid, between water and land, between salt water and fresh, and between the potable and the poisoned. Nature and Society now share equal billing. The elephant of climate change trumpets, as it rampages through what we used to think of as our room. Here and elsewhere, we are castaways amidst the hobgoblins of our own horror show. It is not only the demonic cries of over 100,000 suicides amongst Vietnam Vets and a further 25,000 ex-service men and women dead by their own hand since 2012 – from our more recent wars of empire – that we hear: the psychic airwaves tremor not only with their suffering, their sacrifices and their condemnations but also, as Roy writes of her country, are rent with screams from our own mountain-top lobotomies, sickened streams, clear-cut forests and our daily extinctions.
That pounding rhythm you may hear is propelled by the sonorous bass notes of our deeply troubled history. We too have a nether world populated with those trapped in the purgatory of three jobs, a superannuated car and sub-standard housing; or of those a step below them, who roam the black-top parking-lots and streets amidst shuttered malls and fast-food emporia, car-lots and other materially manifest survivors of our digital age; or lurk at night in the shadows between the mercury vapor security lights and surveillance cameras, thinking idle thoughts, perhaps, of what makes America great or, more pressingly, of where they might spend the night.
And counting.
• US National Debt Tops $20 Trillion For First Time In History (Fox)
The national debt surpassed $20 trillion Opens a New Window. for the first time in U.S. history on Friday. According to data released Monday, the total national debt climbed about $318 billion to $20.162 trillion as of Friday, the same day President Donald Trump signed a bill suspending the debt ceiling and allowing the federal borrowing limit to extend until Dec. 8. The deal Trump signed, which also allocated more than $15 billion in disaster aid for Hurricane Harvey, was passed 316-90 in a House vote; all opposed to the measure were Republicans. “Surpassing $20 trillion in debt is the latest indicator of our nation’s dire fiscal condition,” Michael A. Peterson, president and CEO of the Peter G. Peterson Foundation, said in a statement.
“As a result of our inability to address our growing debt, we are now on pace to spend $6 trillion on interest alone over the next 10 years.” The U.S. debt ceiling had been capped at around $19.84 trillion since March 15. The 2017 fiscal year budget expires at the end of September. “America’s debt is projected to grow and compound rapidly in the years ahead. Our budget deficit is on track to exceed $1 trillion annually in just five years,” Peterson said. “The good news is that many solutions exist. In the coming months, Congress and the administration have a critical opportunity to enact fiscally responsible tax reform that grows the economy, not the debt.”
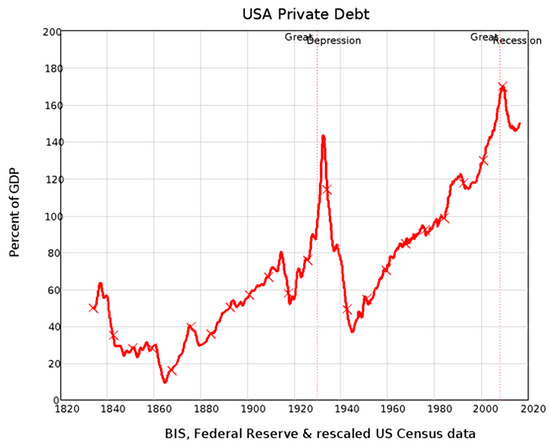
As you know by now, it’s not national debt that is most important. Private debt is.
• None So Blind As Those Who Will Not See (Steve Keen)
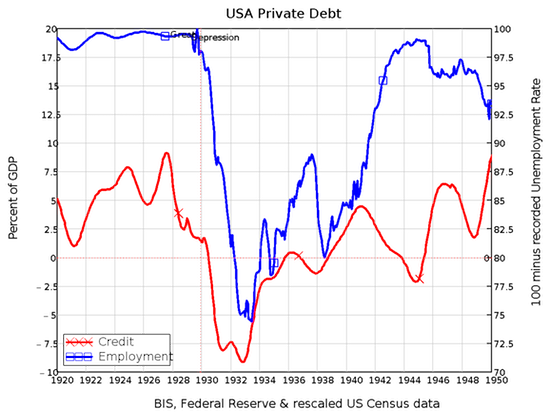
The phrase “There are none so blind as those who will not see” normally turns up in religion, but there is no other way to describe the dominant sect in economics today as wilfully blind. One decade after the crisis, most still repeat their mantra that, though a Nobel Laureate had asserted in 2003 that such crises were now impossible, the one that occurred in 2008 could not have been predicted. Nonsense. The data that showed what would cause the crisis, and arguments by empirically oriented economists, were available before it hit: there was a runaway bubble in asset markets caused by too much credit being created by the banks. Credit—your capacity to buy something with money borrowed from a bank, rather than from your own cash—is exactly equal to the increase in private debt every year.
The bigger this is compared to GDP, the more the economy is dependent on credit; and the bigger the accumulated debt is when compared to GDP, the more likely it is that a reduction in credit will cause an economic crisis. The data, if you look at it, is incontrovertible—especially if you consider the epicentre of the 2008 crisis, the USA, in historical context. The Great Depression was preceded by a margin-debt-fuelled bubble on the US stockmarket, with private debt blowing out during the crisis and then collapsing. That’s exactly what happened in the Great Recession.
Private debt affects the economy in two ways: the higher debt is, relative to GDP, the more that a change in credit impacts on total demand. And credit adds to total demand by allowing people in the aggregate to spend more than just the money they currently have—with the price of leading to a higher level of debt in the future. The correlation between credit and employment is staggering—not just because it is so big (the correlation coefficient, for those who follow these things, is 0.8), but because according to mainstream economists like Ben Bernanke, the correlation should be close to zero.
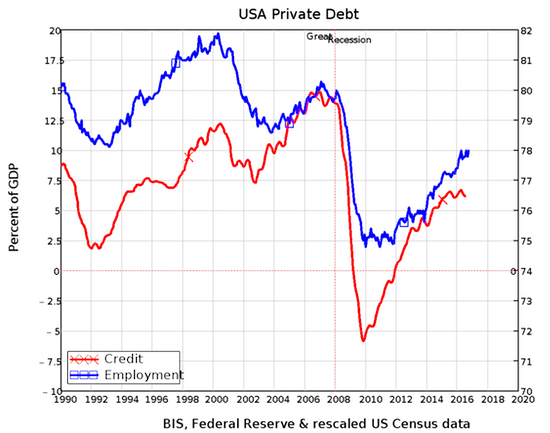
Bernanke, who got the job as Chairman on the Federal Reserve because he was supposed to be the expert on what caused the Great Depression, didn’t even consider similar data that was available at the time, nor the “Debt Deflation Theory of Great Depressions” put forward by Irving Fisher at the time, because he believed that credit was a “pure redistribution”, and “pure redistributions should have no significant macro¬economic effects” (Bernanke 2000, p. 24). Empirically, this is manifestly untrue, but economists turn a blind eye (and not a Nelsonian one) to this data because it doesn’t suit their preferred model of how banks operate. They model them “as if” they are intermediaries who introduce savers to borrowers, not as originators of both money and debt.
Growth keeps shrinking.
• Behind the Potemkin Village (Hussman)
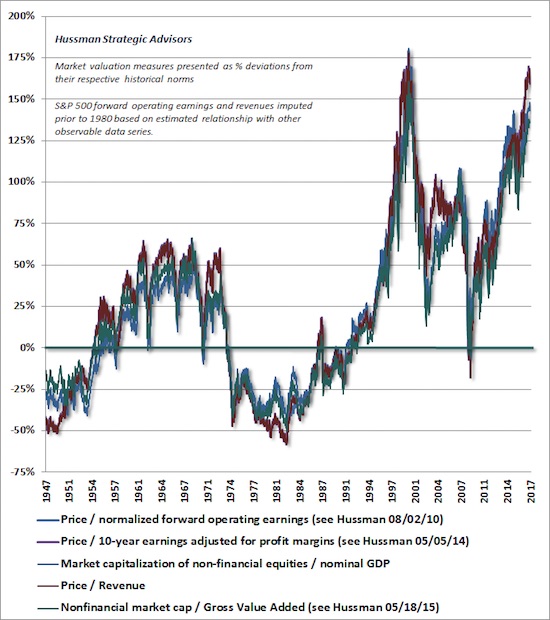
Market returns don’t just emerge from nowhere. They are driven by the sum of three factors: growth in fundamentals, income from cash distributions, and changes in valuations (the ratio of prices to fundamentals). Since 1960, for example, the S&P 500 has enjoyed an average rate of return of about 10% annually, which derives from three main components: growth in earnings (and the overall economy) averaging about 6.3% annually, dividend income averaging about 3.0% annually, and a gradual increase in price/earnings multiples that has contributed about 0.7% annually to total returns. One can also make a similar attribution using other fundamentals.
For example, the 10% annual total return of the S&P 500 since 1960 also derives from growth in S&P 500 revenues averaging 5.7% annually since the 2000 peak, dividend income averaging about 3.0% annually, and a much steeper increase in the S&P 500 price/revenue ratio contributing 1.3% annually (taking the current price/revenue multiple to the same level observed at the 2000 market peak). Consider these drivers today. Combining depressed growth prospects with an S&P 500 dividend yield of just 2.0%, the likelihood is that over the coming 10-12 years, even a run-of-the-mill reversion of valuations will wipe out the entire contribution of growth and dividend income, resulting in zero or negative total returns in the S&P 500 Index on that horizon, with an estimated interim market loss on the order of -60%.
Here are the facts: over the past several decades, due to a combination of demographic factors and persistently slowing productivity growth, the core drivers of real U.S. GDP growth have declined toward just 1% annually, with a likely decline below that level in the coming 10-12 years. Indeed, in the absence of any recession, U.S. nonfarm productivity growth has averaged just 0.8% annually since 2010 and 0.6% over the past 5 years, while the U.S. Bureau of Labor Statistics estimates labor force growth of just 0.3% annually in the coming years (which would be matched by similar growth in employment only if the unemployment rate does not rise from the current level of 4.3%). Add 0.6% to 0.3%, and the baseline expectation for real GDP growth is just 0.9%.
Thanks QE!
• Market Cap to GDP: An Updated Look at the Buffett Valuation Indicator (AdPe)
Market Cap to GDP is a long-term valuation indicator that has become popular in recent years, thanks to Warren Buffett. Back in 2001 he remarked in a Fortune Magazine interview that “it is probably the best single measure of where valuations stand at any given moment.” The four valuation indicators we track in our monthly valuation overview offer a long-term perspective of well over a century. The raw data for the “Buffett indicator” only goes back as far as the middle of the 20th century. Quarterly GDP dates from 1947, and the Fed’s balance sheet has quarterly updates beginning in Q4 1951. With an acknowledgment of this abbreviated timeframe, let’s take a look at the plain vanilla quarterly ratio with no effort to interpolate monthly data.
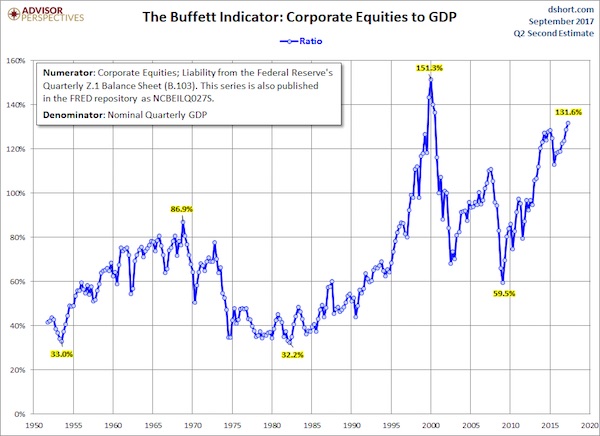
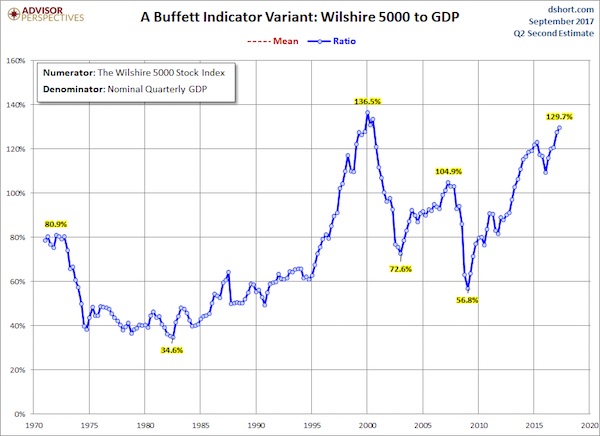
The denominator in the charts below now includes the Second Estimate of Q2 GDP. The latest numerator value is extrapolated based on the quarterly change in the Wilshire 5000. The current reading is 131.6%, up from 128.7% the previous quarter and an interim high. Here is a more transparent alternate snapshot over a shorter timeframe using the Wilshire 5000 Full Cap Price Index divided by GDP. We’ve used the St. Louis Federal Reserve’s FRED repository as the source for the stock index numerator (WILL5000PRFC). The Wilshire Index is a more intuitive broad metric of the market than the Fed’s rather esoteric “Nonfinancial corporate business; corporate equities; liability, Level”. This Buffett variant is also at its interim high.
China is exporting its Ponzi. China is having a hard time attracting international institutions to get involved” in Belt and Road projects, Huo said. “If that persists it will become an one-man show, which is not sustainable.”
• After Roads And Railways, China’s Silk Road Dealmakers Eye Financial Firms (R.)
After ports and industrial parks, the dealmakers leading China’s trillion-dollar push to build a modern Silk Road are turning to the financial sector, targeting Europe’s banks, insurers and asset managers to tap funds and expertise. Last week, sources familiar with the matter said two of China’s most acquisitive conglomerates, HNA and Anbang, had separately considered bidding for the German insurer Allianz. Neither of the two made an offer, but the talks marked a new level of ambition for China: Allianz is a German stalwart, a pillar for local pensions and a global powerhouse with €1.9 trillion ($2.3 trillion) of assets under management. HNA already owns a stake of just under 10% in Deutsche Bank.
Bankers, lawyers and company executives say more financial deals will come, led by state behemoths such as China Life and China Everbright, as well as private firms including Legend Holdings and China Minsheng Financial. “The message from the regulators is clear – they want these companies to go out and get access to large amount of funds and expertise,” said a financial M&A adviser at a global bank, who works with Chinese regulators and companies. “They would look very favorably at transactions that have some links to the Belt and Road program, because the country needs to boost its financial muscle,” the banker said. But Beijing “will ensure the excesses of the past couple of years do not happen again.” The banker said his firm was currently working on several “mid-sized to large” foreign financial takeover deals.
[..] “China is having a hard time attracting international institutions to get involved” in Belt and Road projects, Huo said. “If that persists it will become an one-man show, which is not sustainable.” [..] Chinese companies will not be expanding into the financial services sector at will, of course. Acquisitions of stakes in foreign banks – never mind full ownership – are already closely monitored by overseas regulators. But while banks may be tough targets, bankers and executives say Chinese institutions and conglomerates could instead target asset management, insurance or wealth managers. China Everbright plans to allocate $1.5 billion of its 2017 spending to the purchase of a fund manager, private bank or insurer overseas to help it raise cash more easily and extend its presence abroad.
What happened to currency manipulation? “Policymakers have demonstrated that they have more control over the exchange rate in the short run than many people believed..”
Or is it the US who’s the manipulator these days?
• China Is Performing A High-Wire Balancing Act On The Yuan (CNBC)
China’s yuan weakened against the U.S. dollar on Monday after the government scrapped measures meant to prop up the currency. The central bank removed reserve requirements for financial institutions settling currency forwards, and for foreign banks holding yuan deposits offshore, reversing actions put in place a few years ago to quash depreciation pressures. The actions were always meant to be temporary and scaled back when the yuan regained firmer footing. But the currency’s immediate market reaction to the rule unwinding is a reminder of how precarious Beijing’s high-wire balancing act really is when it comes to the yuan. “Policymakers have demonstrated that they have more control over the exchange rate in the short run than many people believed,” wrote Mark Williams, chief Asia economist at Capital Economics, in a note.
“But they still struggle to manage the expectations that determine medium-term exchange rate pressures.” That’s because China is balancing a number of priorities when it comes to its currency, including engineering stability in the markets ahead of a major leadership shuffle next month. A stronger yuan prompts investors to keep money onshore to chase returns at home. It also lets China defend against long-standing critics, including the U.S., that claim the world’s second-largest economy purposefully keeps the value of the yuan low in order to get a leg up in global trade with cheaper exports. The move is well-timed, as it comes ahead of an expected visit by U.S. President Donald Trump to China later this year, said Callum Henderson, managing director at political risk consultancy Eurasia Group.
Trade tensions have been bubbling between the U.S. and China. But the scales can tip easily the other way — a stronger yuan, coupled with waning demand, is already hurting trade activity. August exports were up 5.5%, posting weaker growth than the 7.2% increase seen in July. On Tuesday, the government lowered its official yuan parity rate to 6.5277 per dollar, snapping an 11-day climb, supporting analyst calls that depreciation worries are subsiding. Despite Monday’s weakness, the yuan is still up 6.5% so far this year against the greenback, and holding onto its erasure of last year’s losses.
Mind the time scales. But nice graph.
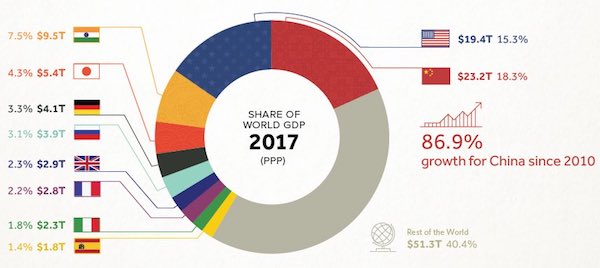
• 2,000 Years of Economic History in One Chart (Visual C.)
Long before the invention of modern day maps or gunpowder, the planet’s major powers were already duking it out for economic and geopolitical supremacy. Today’s chart tells that story in the simplest terms possible. By showing the changing share of the global economy for each country from 1 AD until now, it compares economic productivity over a mind-boggling time period. Originally published in a research letter by Michael Cembalest of JP Morgan, we’ve updated it based on the most recent data and projections from the IMF. If you like, you can still find the original chart (which goes to 2008) at The Atlantic. It’s also worth noting that the original source for all the data up until 2008 is from the late Angus Maddison, a famous economic historian that published estimates on population, GDP, and other figures going back to Roman times.
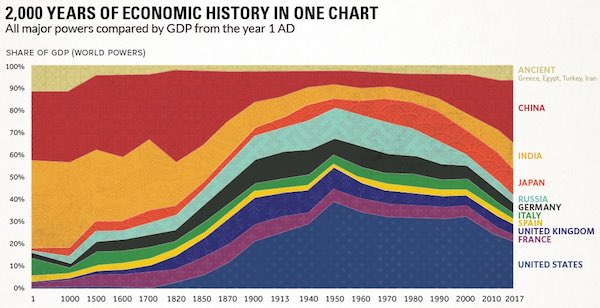
If you looked at the chart in any depth, you probably noticed a big problem with it. The time periods between data points aren’t equal – in fact, they are not close at all. The first gap on the x-axis is 1,000 years and the second is 500 years. Then, as we get closer to modernity, the chart uses mostly 10 year intervals. Changing the scale like this is a big data visualization “no no”, as rightly pointed out in a blog post by The Economist. While we completely agree, we have a made an exception in this case. Why? Because getting good economic data from the early 20th century is already difficult enough – and so trying to find data in regular intervals before then seems like a fool’s errand. Likewise, a stacked bar chart with different years also doesn’t really do this story justice.
How to make Brussels nervous. And Berlin.
• Italy’s Main Opposition Parties Call For New Currency To Flank Euro (EN)
Italy’s leading opposition parties are calling for the introduction of a parallel currency to the euro, which they say will boost growth and jobs. Three of the country’s four largest parties – the Five Star Movement, the Northern League and former prime minister Silvio Berlusconi’s Forza Italia – have proposed introducing a new currency following an election scheduled for next year. The proposals for a parallel currency have replaced the opposition parties’ previous calls to leave the euro completely. By settling on a dual currency, analysts say the parties hope to appeal to anti-euro sentiment in the country while avoiding, for now, the upheaval of an outright exit.
While some lawmakers have said the primary goal of the new currency is to persuade Brussels to change European fiscal rules to allow them to spend more and cut taxes, others backing the scheme have admitted they hope it will help make an eventual euro exit more likely. The proposal is opposed by the European Commission, which says there can only be one legal tender in the eurozone. When the euro was introduced in Italy in 1999, it enjoyed widespread support. However, this has since waned, with many blaming the single currency for drops in living standards and rising unemployment. A poll by the Winpoll agency in March showed that only around half of Italians back the euro. As the election nears, and with opinion polls currently pointing to a hung parliament, only the ruling Democratic Party is not proposing changes to the current euro set-up.
By the slimmest of margins. A deeply flawed idea, and dangerous, to push through things that way.
• UK Landmark EU Withdrawal Bill Passes First Parliamentary Hurdle (Ind.)
Theresa May’s landmark EU (Withdrawal) Bill has passed its first parliamentary hurdle, paving the way for greater powers to be handed to ministers through the first major piece of Brexit legislation. MPs passed the legislation – often referred to as the Repeal Bill – by 326 votes to 290, giving the Government a majority of 36 after no Conservatives rebelled and several Labour politicians defied Jeremy Corbyn’s instruction to vote against. The Prime Minister described the vote as a “historic decision to back the will of the British people”, adding: “Although there is more to do, this decision means we can move on with negotiations with solid foundations and we continue to encourage MPs from all parts of the UK to work together in support of this vital piece of legislation.”
Keir Starmer, the Shadow Brexit Secretary, said it was “a deeply disappointing result” and described the Bill as as “an affront to parliamentary democracy and a naked power grab” by Government ministers. The Bill’s aim is to transpose relevant EU law onto the UK statute book when the UK formally leaves the bloc in March 2019 and will also overturn the 1972 act that took Britain into the European Economic Community. Major concerns had been raised, however, over the so-called Henry VIII powers in the Bill which grants ministers the power to amend law without normal parliamentary scrutiny – the reason for Labour’s decision to oppose the legislation. But as MPs concluded debates at midnight a series of votes were then held. The Bill passed while Labour’s amendment – attempting to block the legislation – was defeated by 318 votes to 296.
Overtaxed. They don’t have it. This is the Shock Doctrine.
• Greek Taxpayers Failed To Pay €2 Billion In July (K.)
The figure of €2 billion in unpaid taxes in July alone, shown the Independent Authority for Public Revenue, is a sharp illustration of the fatigue gripping tax-paying individuals and businesses in Greece. The slump in tax payments has brought expired debts to the state since the start of the year from €5.475 billion by end-June to €7.483 billion by end-July. IAPR officials explain that the debts of three enterprises that went bankrupt expanded the expired debts in July; they say that €700 million of debts concern those three companies that happened to have gone bankrupt in July, while the remaining €1.3 billion concerns unpaid taxes.
If this nightmarish picture continues into the rest of the year, the hole in budget revenues will grow considerably, having already come to €700 million in the first seven months of 2017. What concerns the government most is whether the taxpayers who failed to pay in July enter the Finance Ministry’s 12-installment payment plan. Otherwise – if they refrain from paying their taxes, for example – state coffers will find themselves in serious trouble after the addition of 172,704 taxpayers who added their names to those who defaulted on their obligations in July.
I can attest to the demise of large swaths of the city. Utter insanity.
• Austerity Is Laying Waste To Athens’ Architectural Heritage (G.)
Not that long ago I received a questionnaire through my door. How had the 1930s Bauhaus building in which I live survived the rigours of time? Who had designed it? Who was its first owner? And, the form went on, what were my memories of it? Circulated far and wide across Athens, the questionnaire and its findings are part of a vast inventory of 19th- and early 20th-century buildings that now stand at the heart of a burgeoning cultural heritage crisis in Greece. At least 10,600 buildings in the capital are under threat, as the country navigates its worst economic crisis in recent times. Under the weight of austerity – with bank loans frozen, repeated budget cuts and tax rises kicking in – many buildings have already been allowed to fall into disrepair, or have been pulled down altogether.
“In the present climate, people just don’t have the money to restore them,” says Irini Gratsia, co-founder of Monumenta, the association of archaeologists and architects that is collating the database. “There is a great danger that many will be demolished not because their owners want new builds, but because they want to avoid property taxes announced since the crisis began.” Monumenta estimates that, since the 1950s, as many as 80% of Athens’ buildings from the 19th and early 20th centuries have been destroyed. Now at risk are some of the last surviving examples of Greek neoclassical architecture and Greek modernism, the latter scorned as “cement boxes” when they began to fill the great Attic plain. Mostly constructed between 1830 and 1940, these buildings comprise the rich architectural mosaic of a city – dominated by the 5th-century BC Acropolis – that often goes unnoticed.
Salary considerations? People making €500 a month is normal now. That’s third world.
• Greece Ranked As The Worst Country To Live As An Expat (K.)
Greece was at the bottom of this year’s ranking of the top countries for expats, according to InterNations’ Expat Insider survey. The survey, carried out between February and March this year, asked nearly 13,000 expats about their quality of life and to rank 43 different aspects of life abroad. Factors included job opportunities, salary considerations, quality of life, and safety. Greece was ranked as the worst country to live in mostly due to the financial situation, with half of the respondents saying that their household income was not enough to cover their daily expenses. Bahrain, Costa Rica, and Mexico were ranked the top three destinations for expats.