Jack Delano Walter V. Dew, rear brakeman, on the Atchison, Topeka & Santa Fe March 1943


Oil’s the story.
• World On The Brink Of Oil War As OPEC Bickers Over Price (Telegraph)
A secretive group of the world’s most powerful oil ministers will soon gather in Vienna to take arguably one of the most important decisions that could affect the still fragile world economy: whether to cut production of crude to defend prices at $100 per barrel, or keep open the spigots as winter looms among the biggest energy-consuming nations? A sudden slump in the price of crude has exposed deep divisions within the Organisation of Petroleum Exporting Countries (Opec) ahead of its final scheduled meeting of the year next month to decide on how much oil to pump. Some members, led by Iran, have called for immediate action to stem the drop in oil prices, while the Arab sheikhdoms of the Gulf have so far argued that it could be another three months before it becomes clear whether the group should cut production for the first time since December 2008.
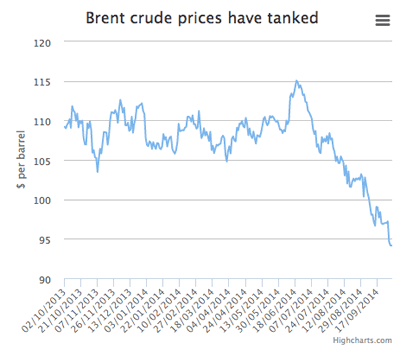
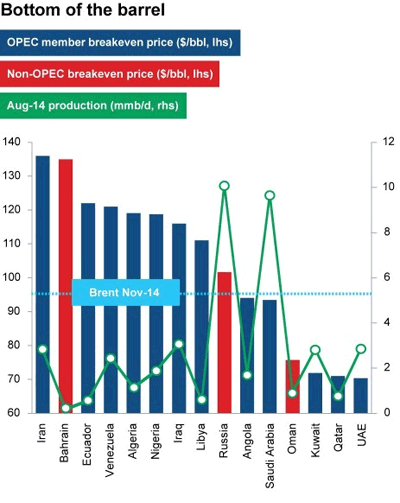
Whatever they decide, oil remains the lifeblood of the global economic system due to its direct impact on inflation and input prices. Brent crude – a global benchmark of oil drawn from 15 fields in the North Sea, dipped last week to multi-year lows below $92 per barrel as a perfect storm of a strong US dollar, oversupply in the system and declining demand shattered confidence in the market. Brent has tumbled 20pc in the last three months after touching $115 per barrel in June. In the US – the world’s biggest consumer – crude for November delivery at one point last week dropped below the psychologically important $90 pricing level, raising fears that a prolonged slump could put many of America’s shale drillers out of business. Shale oil, which can cost up to $80 per barrel to produce, has spurred an energy revolution in the US, which has started to threaten the dominance of producers in the Middle East. However, at current price levels many of these new so called “tight oil” wells are approaching the point when they will soon become unprofitable.
Like the situation in the US, falling oil prices are also a double-edged sword for Britain’s economy and investors. Although George Osborne, the Chancellor, is less reliant on tax revenues from the North Sea than some of his predecessors, prices are approaching the point when many of the developments planned offshore west of Shetland by international oil companies could be placed on ice. A sharp drop-off in domestic oil production and associated tax receipts from the North Sea would give Mr Osborne an unwelcome hole to fill in the government’s public finances heading into next year’s general election. However, falling oil prices will help to keep inflation low. For Britain’s motorists the current declines have been good news that has trickled through to the price of petrol on forecourts. A litre of unleaded petrol in the UK has fallen a few pence over the past month to an average of around 127.21p on average, a figure last seen in 2011, just before Mr Osborne raised the value added tax on fuel to 20pc, from 17.5pc.
All eyes are now firmly focused on the next move by Opec, which controls 60pc of the world’s oil reserves and about a third of daily physical supply. The group has been branded an unaccountable “cartel” by free-market critics in North America who claim its system of limiting production by setting an output ceiling and quotas is tantamount to price rigging. Although this is an accusation that the group’s secretariat which is based in Vienna strongly denies, its mostly unelected group of policymaking oil ministers undeniably pull the strings of the global energy industry in the same way that central bankers can control currencies. Opec states have largely managed to maintain cohesion over the last decade as prices over $100 per barrel have enriched their economies and encouraged adherence to quotas. This consensus is now starting to break down, creating more uncertainty in the market and a potentially destabilising situation for the global economy.
Read more …
• Why The Crude Oil Crush Could Accelerate (CNBC)
Crude oil has gotten crushed this week, with West Texas Indermediate futures falling below $90 per barrel on Thursday for the first time in more than a year. And though oil has staged a mild comeback over the course of the session, crude oil futures are still 15% below the high set in June. At this point, traders say bearish fundamentals and an awful-looking chart could point to more downside ahead for oil. The main cause for the crude decline comes out of the Middle East, where Saudi Arabia surprised the market by opting not to cut production even in the face of declining prices. And according to trader Brian Stutland, “the Saudis are just starting to feel the heat. U.S. production has really put some pressure on them.”
Yet even as supply will be higher than expected, Stutland noted on Thursday’s “Futures Now” that the European economy continues to be in major trouble “which is weakening demand global, so it’s not just a supply thing—it’s a demand thing overseas.” Jim Iuorio says the chart doesn’t make things look much better. He notes that oil has fallen below a key level of support around $91, which could lead to further selling. “From a technical standpoint, I think it’s broken some levels and some damage has been done to the chart. If we start to see some weakness again and the November contract trades $90.30,” Iuorio would want to get short. The broader view for crude looks bearish as well. Fadel Gheit of Oppenheimer points out that since technology has reduced production costs into the $60s per barrel, oil prices are now more at home in the $80s than at $100. To capitalize on a further drop in crude, Iuorio recommends selling November crude oil futures at the aforementioned $90.30 price, with a target of $87.70.
Read more …
Easy to forget amid all the confidence plays, but the Fed is in totally unknown territory, has been since 2007. They have no idea what will work.
• How The Fed Is Dangerously Deforming The Money Markets (Alhambra)
“We don’t exactly know how it will work” should be stamped upon every message coming from the policymaking apparatus from this point forward, and then retroactively applied to every message in the age of risk and rate repression. Action in short-term money markets has heated up yet again, and that is not a positive statement toward vital function. To “exit” from monetary policy as corruptive as it has been, the FOMC and its staff believes a European-style policy framework is “needed.” It is not to be an exact replica, mind you, only the general idea borne out under decidedly American conditions and characteristics. The Fed is trying to build a rate corridor where one never existed, and I would contend never should. Part of the reason is that the federal funds rate applies less and less to anything of any import, more a relic than a policy measure. After 2007, unsecured overnight lending has been far more of a dream than anything of operational concern, thus the vastly increased relative importance of secured wholesale finance, i.e., repo.
To get from fed funds targeting to repo is not an easy leap, particularly since we are again introducing the discrepancy of dollars vs. interbank currency (where it is often difficult to discern which one is more money-like at any one point in time). The reverse repo program was supposed to provide “aid” toward establishing a hard(er) floor for rates. It obviously failed with the persistent spikes in repo fails, which denote effective repo rates at something between 0% and -3% (and closer to the latter than the former). Collateral, that interbank currency, is not getting out of the Fed “silo” (its vast SOMA holdings) to conduct business as needed. Back in August, some FOMC comments in this direction show just how much they rely on unproven theory:
Officials plan to use the rate of interest the Fed pays on excess reserves deposited at the central bank as the “primary tool used to move the federal funds rate into its target range” while “temporary use” of the overnight reverse repo facility will be employed to “help set a firmer floor,” according to the July FOMC meeting minutes. “If we can move those three rates in tandem, then I think it will be pretty clear signaling to markets as to where the Fed stands and where short-term interest rates stand,” Bullard said. “We’ve never done this before, so we don’t know exactly how it will work, but I do think that we are in pretty good shape.” [emphasis added]
They already had more than a little whiff of failure in repo fails, so the statement above was already stale at the point it was issued.
Read more …
“Only 43.6% of young adults currently hold a full-time job. 53% are either jobless or underemployed relative to their education.”
• Obama’s Economic Recovery In Pictures (STA)
On Thursday, President Obama will give a speech at Northwestern University’s Kellogg School of Management on the economy. This issue is critical going into the mid-term elections as virtually every poll shows this is a top concern of voters. The question of economic recovery is interesting in the context of where that recovery has occurred. As I discussed recently in “For 90% Of Americans, There Has Been No Recovery,”while the ongoing interventions by the Federal Reserve have inflated asset prices, the only real accomplishment has been a widening of the wealth gap between the top 10% of individuals that have dollars invested in the financial markets and everyone else.

Another problem for the President at Northwestern University is that he will be trying to promote his success on economic recovery to a group of individuals who are currently plagued with a poor slate of economic statistics. The unemployment rate for 18-29 year-olds is nearly 12%. Over 30% are still living with parents more than two years after graduation. Only 43.6% of young adults currently hold a full-time job. 53% are either jobless or underemployed relative to their education. These stats are going to make promoting an “economic success” story rather difficult. However, let’s review Obama’s economic scorecard in terms of the things that truly matter to the average American.
There is only one chart of employment that truly matters: the number of full-time employees relative to the working age population. Full-time employment is what ultimately drives economic growth, pays wages that will support household formation and fuels higher levels of government revenue from taxes. If the economy were truly beginning to recover, we should be witnessing an increasing number of full-time employees. Unfortunately, that has not been the case as this measure, as shown by the chart below, is only slightly off the lows witnessed during the financial crisis.

Given that nearly 70% of economic growth is driven by personal consumption expenditures, the sluggishness of economic growth since the financial crisis can be directly attributed to a fall in personal incomes. According to a recent Federal Reserve survey, median household before-tax incomes have fallen from near $52,000 annually to roughly $47,000 currently.

Read more …
Draghi’s ABS plans are mostly dead already. He can buy German and Dutch paper, but not the countries that need the help.
• ECB Becoming ‘Junk Bank’ Under Draghi: Merkel Ally (Reuters)
A leading member of German Chancellor Angela Merkel’s Bavarian sister party criticised European Central Bank chief Mario Draghi on Saturday, saying he was turning the institute into a “junk bank” with his plans to buy debt rated as junk. In a stinging attack, Hans Michelbach of the Christian Social Union (CSU) said Draghi was endangering the stability of financial markets. “Draghi is increasingly transforming the ECB into a junk bank,” Michelbach told Reuters. On Thursday, the ECB laid out plans to buy rebundled packages of debt and covered bonds, secured on solid assets such as property. It will include buying debt with a “junk” credit rating from Greece and Cyprus as long as such states are under a formal international financial programme. Michelbach, who is chairman of the conservative faction in the parliamentary financial committee, said the ECB now wanted to buy the kind of “opaque debt” that was largely to blame for the outbreak of the global financial crisis in 2007/2008.
“Draghi, a former investment banker, has not learnt anything in his role as head of the ECB. He was and still is the wrong person for the job,” Michelbach said. With its “Draghi politics”, the ECB is helping countries that are not reforming, he said. “Draghi is ridiculing the people in Europe who have taken burdens upon themselves to shore up the future of their countries by means of reforms,” Michelbach added. He said the planned purchases of debt, which the ECB hopes will boost lending and so boost the euro zone economy, would mobilise “not one single extra euro of loans” in the single currency bloc. “Draghi looks like he is at his wit’s end and he’s trying to cover it up by performing increasingly absurd pirouettes,” Michelbach said.
Read more …
Ugly stuff. But Europe don’t need to lead Japan and China anywhere, they’re more than capable of finding the dead ends themselves.
• Will Europe Lead the World Into Another Financial Crisis? (Phoenix)
In 2012, ECB President Mario Draghi, pulled the EU back from the brink of collapse by promising to do “whatever it takes” in the summer of 2012. Since making that promise, the two biggest problem countries for the EU, Spain and Italy, have both seen the yields on their bonds fall. Draghi’s promise also lit a fire under EU stocks, with Spanish, Italian, and German markets roaring higher.

It is critical to note that Draghi accomplished this without actually doing anything. All he did was make a verbal commitment. The only problem with this is that while sovereign bond yields have fallen and EU stocks have rallied, the EU economy has not recovered. GDP growth for the EU as a whole was a measly 0.2% in 2014… the same as fourth quarter 2013. Indeed as the below chart indicates, the supposed “recovery” Draghi had hoped his promise would create has failed to manifest.

Draghi tried to gun the system by cutting interest rates to negative in June then launching an asset purchase program this month… but neither policy looks to be changing anything.
Italy is back in recession for the third time since 2008. Germany’s economy contracted in the second quarter of 2014 and will likely be in recession before the first quarter of 2015. France has registered zero growth for six months now. And the markets smell “trouble.” European financials have taken out the trendline that supported them since the 2012 bottom:

Europe’s crisis is not over, not by a long shot. Mario Draghi has thrown everything, including the kitchen sink, at the economy over there and has failed to create sustainable growth. It’s now just a matter of time before the next round of the Financial Crisis hits and the whole mess comes crashing down.
Read more …
Break it up!
• How Finance Quietly Took The World Hostage (Zero Hedge)
While we have beaten the dead horse topic of collapsing global of CapEx (per Citi, net capex is now unchanged since 2000), we now have a clearer understanding why there is no global growth, why trade is plunging, and why world commerce is rapidly grinding to a halt. The answer lies in the following chart which shows the relative proportion of what the world has been investing in for the past two decades.

It shows that while investment in most traditional categories has fallen off a cliff, the money spent for business activities, i.e. services, has soared at the expense of such conventional growth components as trade, manufacturing, petrochemicals, and food and beverage. But the punchline, and what is by far the scariest, is that rising from 19% to a record 30%, and by far the biggest use of funds, is finance, the one industry that doesn’t actually lead to growth but merely finds ways to mask the lack of growth with pro-forma adjustments and stacks leverage upon leverage on ever declining underlying equity and cash flows, until the entire system crashes as it did in 2001, 2008 and, well, soon.
It also means that forget Too Big To Fail banks: the entire financial industry has now become the monster behemoth whose crash will wipe out the world, and hence why it can never be allowed to crash. One could say that in the past two decades, finance itself succeeded in taking the world hostage and can demand any ransom… or the world gets it. A ransom, which the global central banks are all too happy to pay to let “finance” get its way, in the biggest Mutual Assured Destruction scenario in world history.
Read more …
They’ll just deny it for the next 15 months.
• Greece Will Be In Default Within 15 Months, S&P Warns (Zero Hedge)
Remember Greece: the country that in 2010 launched Europe’s sovereign solvency crisis and the ECB’s own helpless attempts at intervention, which later was “saved”, only to default shortly thereafter (but without triggering CDS as that would end the Eurozone’s amusing monetary experiment and collapse the Deutsche Bank $100 trillion house of derivative cards), which later was again “saved” when every single global central bank made sure Greek bonds became the only yield-generating securities in the world? Well, the country which at last count was doing ok, is about to not be ok. Because according to none other than S&P, at some point over the next 15 months, Greek debt is about to be in default when the country is no longer able to cover its financing needs. In other words, back to square one. As Bloomberg reports, citing Real News, S&P analyst Marie-France Raynaud said Greece can’t cover its own financing needs. How is that possible? Isn’t Europe so fixed, it no longer has anything to worry about except deflation, pardon, inflation?
Guess not. According to Bloomberg, S&P estimates Greek financing needs for the next 15 months to be at €43 billion. This is a problem because even if Greece sells bonds this year and next, sales won’t be enough to cover net financing needs. So maybe Greece will sell more bonds? Well, the problem with that is that the second the LIFO paradigm of bond investing no longer works, and the last guy in may be stuck holding the bag, nobody will want to buy 1 penny in debt issued by Greece. The specifics: S&P estimates Greece will draw €5 billion from intl bond sales, €20 billion from internal mkt, €12 billion from official lenders inluding the IMF in next 15 mos. S&P also forecasts Greece will repay €3 billion in bonds held by investors who refused to participate in 2012 debt writedown, and if it doesn’t then Greece will following Argentina in being held in “contempt to court” for cramming down foreign law covenants. Just kidding: that would mean the global legal system actually works instead of serves merely to make the rich richer.
As for Greece, it appears that suddenly the idyllic image of its recovery is about to be torn to shreds and the Syntagma riotcam will have to come out of hibernation. Or maybe it won’t. In a case of populist pandering that Obama himself would be proud of, at the same time as the S&P report hit, the Greek premier Antonis Samaras said in a Kathimerini op-ed that if political stability isn’t threatened, Greece won’t need emergency loans in a few months, and will achieve final settlement on public debt. He added that liquidity in Greece will be restored after ECB stress tests on country’s lenders and that in stark contrast to what S&P just said, Greece doesn’t need new bailout agreement, no new loans. Actually, it will. The backdoor left open by Samaras is that “achievements will be endangered in case of political instability, and if parliament has to elect president” adding that the “government will not allow those who want the country to commit suicide to have it their way.”
Read more …
When everyone has either long forgotten or died.
• Geithner Due in Court to Explain ’Loan Sharky’ AIG Rate (Bloomberg)
Federal regulators cut a “loan sharky” interest rate on an $85 billion bailout loan to American International Group Inc. (AIG) because it contributed to a debt service problem that threatened the insurer’s credit rating, the top lawyer for the Federal Reserve Bank of New York testified in a Washington federal court. “We were part of the problem in setting that very high rate,” Thomas Baxter testified yesterday. Timothy Geithner, the head of the New York Fed at the time and the man who, according to Baxter, authorized that rate, will get a chance to explain his thinking next week when he takes the witness stand in the trial of a $25 billion illegal “takings” lawsuit by Maurice “Hank” Greenberg’s Starr International Co.
Geithner will be joined in court by two other men seen as the architects of the bailout loan as well as of the broader U.S. response to the 2008 financial crisis, former Treasury Secretary Henry Paulson and Ben Bernanke, the former chairman of the Federal Reserve. The 12% interest rate, agreed to by AIG, which “in loose language I have referred to as a loan sharky rate,” was lowered after ratings agencies threatened a ratings downgrade in November 2008, two months after the bailout began, according to Baxter. He didn’t say how much the rate was reduced. Starr, AIG’s largest shareholder at the time of the bailout, claims the government punished AIG by demanding equity and imposing an an interest rate on the loan of, in effect, 14%. The complaint alleges the U.S. didn’t have the legal authority to require equity as consideration for the loan.
Read more …
• Putin Rejects US-Style ‘Easy Money’ Stimulus In Russia (RT)
Russia must be careful with any monetary stimulus, and can’t be injecting billions into the economy to make it grow, as the US has been doing, President said at VTB’s Russia Calling! investment forum. Russia plans to increase internal debt, but will go about it more carefully than US, so it doesn’t hurt the real economic sector. “Domestic debt will increase, because it’s at a record low level. But we’ll proceed carefully,” Putin said. “We need to improve our growth not by means of monetary injections, but by structural reforms.” This was Putin’s answer to a question on whether Russia is going to provide special support for the country’s financial markets at a time when access to foreign long-term borrowing is curtailed by sanctions.
The President outlined that Russia’s budget for the next three years will continue with a more prudent approach to debt. “The federal budget of 2015 and of 2016-2017, which the government has presented to the State Duma, proposes a rather moderate deficit, just 0.5-0.6% of GDP, with the base price of crude oil set at $96 per barrel. These are stable basic parameters which allow strict compliance with all budget liabilities, including social ones,” Putin said.
Read more …
Wonder what they’ll do once it gets cold.
• Gazprom Accuses Poland, Hungary, Slovakia Of Rerouting Gas To Ukraine (RT)
Poland, Hungary, and Slovakia have together re-exported 1.7 billion cubic meters of Russian gas to Ukraine, Gazprom, Russia’s biggest gas exporter said Friday, questioning the legality of the practice. “There is every reason to believe that Russian gas is being delivered to Ukraine that isn’t intended for them, but for other European customers. This is generally done under the ‘virtual reverse gas flow’ scheme, but we have seen gas movements across the Ukrainian border,” as TASS quotes Deputy Chairman of Gazprom Aleksandr Medvedev. The data was compiled at the request of Vladimir Gutenev, first deputy head of the industry committee of Russia’s lower house of parliament. A total of 3.8 billion cubic meters was imported from Slovakia, Poland, and Hungary between 2012-2014, and 1.7 billion cubic meters so far this year.
The amount indicates that Naftogaz, Ukraine’s state oil and gas company, is not following the conditions of its contract with Gazprom, Aleksandr Medvedev said. “To ensure reverse gas flows to Ukraine, the Ukraine and the gas transportation companies of Poland, Hungary and Slovakia have reconstructed their gas pipeline systems, allowing transporting gas via the border and its consumption metering,” Medvedev said. After Russia turned off supplies to Kiev in June over the climbing debt, Ukraine has been working closely with European partners to diversify gas supplies, including reverse flow, or the re-export of Russian gas into Ukraine. As supplier, Gazprom maintains this is illegal under the existing contracts.
Read more …
Now we need Iran?
• Iran ‘Not Ready’ To Replace Russian Gas Supplies To EU – Rouhani (RT)
Iran is not ready to satisfy EU’s gas demand and replace Russia as a key supplier if sanctions against Tehran are lifted, said Iran’s President Hassan Rouhani. He added that the country lags behind in gas extraction. “As you know, Iran has the largest deposits of gas,” Rouhani said. “But we lag behind in gas output and so we first think about the domestic demands,” said Rouhani in an interview with Rossiya 1 news channel. Rouhani added that “from time to time” Iran has problems with gas during winter.
“We have many buyers, clients around us… All our neighbors to the east, west and south want to buy gas which we are yet to extract,” he said. According to the president, “now the conditions are not like those when everybody thinks that if Russia stops gas supplies [to the EU], Iran would provide [Europe] with the same [amount of] gas.” He added that the country’s production is “far from this stage.” In the meantime, Rouhani said that Iran is willing to cooperate with Russia in the gas sector.
Read more …
Absolutely hate to say it, but maybe a first Ebola death on US soil is what it takes.
• Ebola Patient In US Takes Turn For The Worse (Reuters)
The first Ebola patient diagnosed in the United States took a turn for the worse on Saturday, slipping from serious to critical condition, as health officials reported fielding scores of possible cases around the country that proved to be false alarms. Dr. Thomas Frieden, director of the U.S. Centers for Disease Control and Prevention, said news of the Ebola patient in Dallas had alerted hospitals nationwide to check incoming patients for potential risks, particularly those who had recently traveled from the center of the outbreak in West Africa.
The CDC has identified nine people who had contact with the Dallas patient from Liberia, Thomas Eric Duncan, and therefore may have been exposed to the virus, and an additional 40 are being monitored as potential contacts. None have shown symptoms, Frieden said. Frieden also said U.S. health authorities have responded to inquiries regarding more than 100 potential cases of Ebola since Duncan tested positive earlier this week, but no new infections have been identified. On Saturday, CDC officials dressed in biohazard suits escorted two passengers off a United Airlines jet that landed at Newark Liberty International Airport in New Jersey because they were believed to be from Liberia and exhibiting signs of illness during the flight.
Read more …
Big step in quantum computing.
• Sub-Atomic Particle Observed That Is Both Matter And Antimatter (RT)
After 80 years of painstaking experimentation, scientists have directly observed a sub-atomic particle that is its own antiparticle. The breakthrough promises a leap forward in quantum computing and potentially shows the path to finding dark matter. The particles are called the Majorana fermions, after the Italian scientist who proposed their existence back in 1937. Quantum theory was in its infancy at the time, and scientists first theorized that antimatter existed: an opposite particle to the commonly-observed electrons and other particles were necessary for quantum equations to work. Although since then many forms of antimatter have been observed, the Majorana fermion remained elusive for decades, partially because it virtually doesn’t interact with regular particles. A team of researchers at the Delft University of Technology in the Netherlands reported a possible discovery of evidence of the Majorana back in 2012, but other scientists pointed out that their results could have been caused by other phenomena.
Now a team led by Professor Ali Yazdani of Princeton University and his team, which included colleagues from University of Texas-Austin, seem to have pinpointed the particle in an experiment that required months of careful adjustments, a two-story tall microscope floating in an ultralow-vibration lab at the campus and an environment of almost absolute cold. They published the results in the October 2 issue of the journal Science. The setup was first proposed by Russian-born physicist Aleksey Kitaev, now a professor at the University of California-Santa Barbara, who predicted in 2001 that Majoranas would emerge on the ends of a superconductuve wire under certain magnetic conditions. Given a certain length of the wire, these particles would not annihilate each other due to spatial separation.
Read more …