Doc Robinson
Forum Replies Created
-
AuthorPosts
-
Doc Robinson
ParticipantD Benton Smith: “An extremely important couple of measurements and at least one major distinction is missing from recent reports out of Santa Clara County and Denmark. The distinction is whether they are testing general population for post-recovery levels of antibodies or simply “any detectable” level of antibodies…”
Below is a link to the full report for the Santa Clara County study. It’s complicated. They were looking for “the presence of active and past infections” based on “positive cases by either IgG or IgM [antibodies].” The test kits were tested with known samples (positive and negative) and the test results were adjusted accordingly. The estimate range reflects different scenarios for test sensitivities, expected false negatives, etc.
Some general informaton on IgG and IgM antibody tests from another source:
When IgM antibodies are present, they can indicate that a patient has an active or recent infection with SARS-CoV-2.
IgG antibodies develop later following infection, and generally do not begin to appear until 7 – 10 days after infection.
[Note: according to the CDC, COVID-19 symptoms may appear 2-14 days after exposure to the virus.]
When IgG antibodies are present it, often indicates a past infection but does not exclude recently infected patients who are still contagious, especially if detected with IgM antibodies.
It is unknown how long IgM or IgG antibodies to SARS-CoV-2 will remain present in the body after infection and if they confer immunity to infection.The full report for the Santa Clara County study:
https://www.medrxiv.org/content/10.1101/2020.04.14.20062463v1.full.pdf
https://www.medrxiv.org/content/10.1101/2020.04.14.20062463v1.full.pdfParticipantDr D: “so 37% already have it?”
Researchers looked at a homeless shelter within a COVID-19 hotspot in Boston, and came up with 37% of the population there having it (in the homeless shelter).
Researchers looked at Santa Clara County in California and came up with about 2% to 4% of the population there having it (in the entire county).
ParticipantHuskynut: “If seasonal flu can be asymptomatic then comparing case fatality rates (Covid vs seasonal flu) is an apples-to-oranges data comparison.”
Yes, seasonal flu can be asymptomatic.
Participantanticlimactic: …it does seem there are a large number of people who have no symptoms, the lowest estimate seems to be 30% but it could be twice that.
30-60% asymptomatic? It seems to be a lot lower than that, for the general population. The results of the Stanford study (for Santa Clara County) concluded that “the population prevalence of COVID-19” ranged from 2.49% to 4.16%, including the asymptomatic.
https://www.medrxiv.org/content/10.1101/2020.04.14.20062463v1
ParticipantKimo: “The original research at Stanford concludes “a range between 48,000 and 81,000 people infected in Santa Clara County by early April”. “As of Friday, it officially had recorded 1,833 cases and 69 deaths related to coronavirus.” I calculate an infection fatality rate of 0.14%, assuming 48K infections. The CDC Flu fatality rate is 0.14% (61K/45M). Once infected, the fatality outcome is not different between this CCP virus and the flu.“
That is a false equivalence. The Stanford numbers (48,000 to 81,000) include the asymptomatic (in a representative sample of the population), while the CDC data only includes the symptomatic. If the CDC included the asymptomatic cases, then the flu fatality rate would be less than 0.14%, possibly much less.
Here’s how the CDC’s 0.14% number can be calculated:
Estimated influenza disease burden — United States, 2017-2018 influenza season
A. Symptomatic Illnesses Estimate 44,802,629
B. Deaths Estimate 61,099
C. Case Fatality Rate = B/A = 0.14%From Table 1
https://www.cdc.gov/flu/about/burden/2017-2018.htmParticipantDid a little bit of fact-checking.
From yesterday’s comments
Dr D: “This morning, a Boston shelter found 100% of residents had it with 0% symptoms.”From today’s comments
Dr D: “Covered Boston in yesterday’s comment. (and too much more) So everybody has it now? It’s over?”From the news article (linked above)
“The broad-scale testing took place at the shelter in Boston’s South End a week and a half ago because of a small cluster of cases there. Of the 397 people tested, 146 people tested positive. Not a single one had any symptoms.”100%, 37%, same difference?
The way I read the news, there was a cluster of cases in the neighborhood of the homeless shelter, so 397 people at the shelter were tested, and 37% tested positive. None of which were symptomatic. Perhaps the symptomatic were already removed from the homeless shelter population? Perhaps diseases spread quicker in a communal living situation like a homeless shelter?
ParticipantOne hypothesis:
Why Infants Rarely Die of COVID-19 and Morbidity and Mortality Rates Vary by Location: Pneumococcal and Hib Vaccinations…
Two conundrums have puzzled COVID-19 investigators: 1) morbidity and mortality is rare among Infants and young children and 2) rates of morbidity and mortality exhibit very large variances across nations, locals and even within cities. These differences correlate with rates of Haemophilus influenzae type B (Hib) and pneumococcal vaccination, which are almost universal among infants and vary widely by geography among adults and the elderly. The higher the rate of vaccination, the lower the COVID-19 morbidity and mortality.
ParticipantFYI and FWIW
WHO Sets 6 Conditions For Ending A Coronavirus Lockdown
…Any government that wants to start lifting restrictions, said Tedros of WHO, must first meet six conditions:
1. Disease transmission is under control
2. Health systems are able to “detect, test, isolate and treat every case and trace every contact”
3. Hot spot risks are minimized in vulnerable places, such as nursing homes
4. Schools, workplaces and other essential places have established preventive measures
5. The risk of importing new cases “can be managed”
6. Communities are fully educated, engaged and empowered to live under a new normal
The details from the original WHO document:
Transitioning to and maintaining a steady
state of low-level or no transmissionFor many countries and subnational authorities and
communities, managing a controlled and deliberate transition
from a scenario of community transmission to a sustainable,
steady state of low-level or no transmission is, at present,
the best-case outcome in the short and medium term in the
absence of a safe and effective vaccine. For countries yet
to report community transmission, preventing the escalation
of transmission and maintaining a steady state of low-level
or no transmission may be feasible.Achieving either of these aims will hinge on the ability
of national and/or subnational authorities to ensure
that six key criteria are satisfied:1 COVID‑19 transmission is controlled to a level of
sporadic cases and clusters of cases, all from known
contacts or importations and the incidence of new cases
should be maintained at a level that the health system can
manage with substantial clinical care capacity in reserve.2 Sufficient health system and public health capacities
are in place to enable the major shift from detecting
and treating mainly serious cases to detecting and
isolating all cases, irrespective of severity and origin:
• Detection: suspect cases should be detected quickly
after symptom onset through active case finding,
self-reporting, entry screening, and other approaches;
• Testing: all suspected cases should have test results
within 24 hours of identification and sampling, and
there would be sufficient capacity to verify the virus-free
status of patients who have recovered;
• Isolation: all confirmed cases could be effectively
isolated (in hospitals and/or designated housing for mild
and moderate cases, or at home with sufficient support
if designated housing is not available) immediately and
until they are no longer infectious;
• Quarantine: all close contacts could be traced,
quarantined and monitored for 14 days, whether
in specialized accommodation or self-quarantine.
Monitoring and support can be done through
a combination of visits by community volunteers,
phone calls, or messaging.3 Outbreak risks in high-vulnerability settings
are minimized, which requires all major drivers
and/or amplifiers of COVID‑19 transmission to have
been identified, with appropriate measures in place
to minimize the risk of new outbreaks and of nosocomial
transmission (e.g. appropriate infection prevention
and control, including triage, and provision of personal
protective equipment in health care facilities andresidential
care settings).4 Workplace preventive measures are established
to reduce risk, including the appropriate directives
and capacities to promote and enable standard COVID-19
prevention measures in terms of physical distancing, hand
washing, respiratory etiquette and, potentially, temperature
monitoring.5 Risk of imported cases managed through an
analysis of the likely origin and routes of importations,
and measures would be in place to rapidly detect and
manage suspected cases among travelers (including
the capacity to quarantine individuals arriving from
areas with community transmission).6 Communities are fully engaged and understand that the
transition entails a major shift, from detecting and treating
only serious cases to detecting and isolating all cases, that
behavioural prevention measures must be maintained, and
that all individuals have key roles in enabling and in some
cases implementing new control measures.Decisions about when and where to transition must
be evidence based, data driven and implemented
incrementally. It is essential to have real-time, accurate data
on the testing of suspected cases, the nature and isolation
status of all confirmed cases, the number of contacts per
case and completeness of tracing, and the dynamic capacity
of health systems to deal with COVID-19 cases.To reduce the risk of new outbreaks, measures should be
lifted in a phased, step-wise manner based on an assessment
of the epidemiological risks and socioeconomic benefits
of lifting restrictions on different workplaces, educational
institutions, and social activities (such as concerts, religious
events, sporting events). Risk assessments may eventually
benefit from serological testing, when reliable assays are
available, to inform understanding of population susceptibility
to COVID-19.Ideally there would be a minimum of 2 weeks (corresponding
to the incubation period of COVID-19) between each phase
of the transition, to allow sufficient time to understand the
risk of new outbreaks and to respond appropriately.https://assets.documentcloud.org/documents/6838637/COVID-19-Strategy-Update-14April2020.pdf
ParticipantDr. D: “Apparently everybody already has it (CA), but we’re still all going to die (don’t open).”
Everybody?
Even with the adjusted rate of infection as found by the study, only 3% of the population has coronavirus – that means 97% does not. To reach herd immunity 50% or more of the population would have to be infected and recovered from coronavirus.
“Herd immunity” depends on reinfection not happening. But if those who recovered from Covid-19 (or were infected without having any symptoms) can get sick again from Covid-19 sometime in the future, then what?
“There is no evidence that people who have recovered from coronavirus have immunity to the disease... there is no proof that such antibody tests can show if someone who has been infected with COVID-19 cannot be infected again.”
(quotes are from articles posted above)
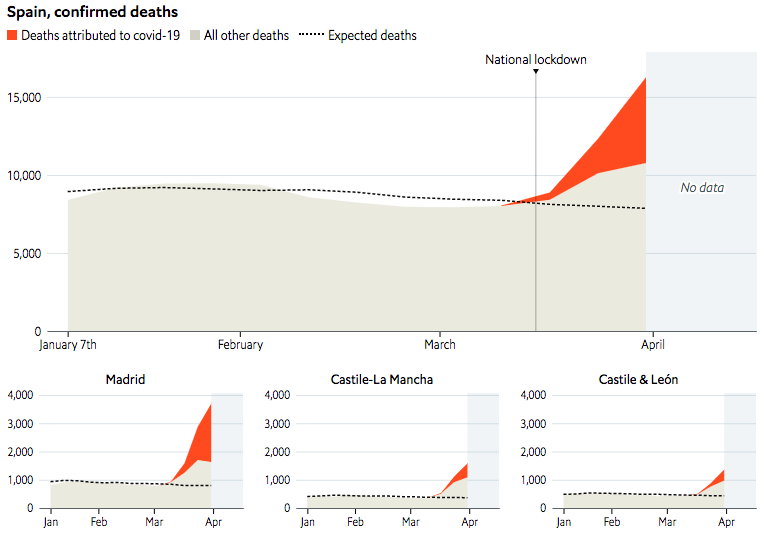
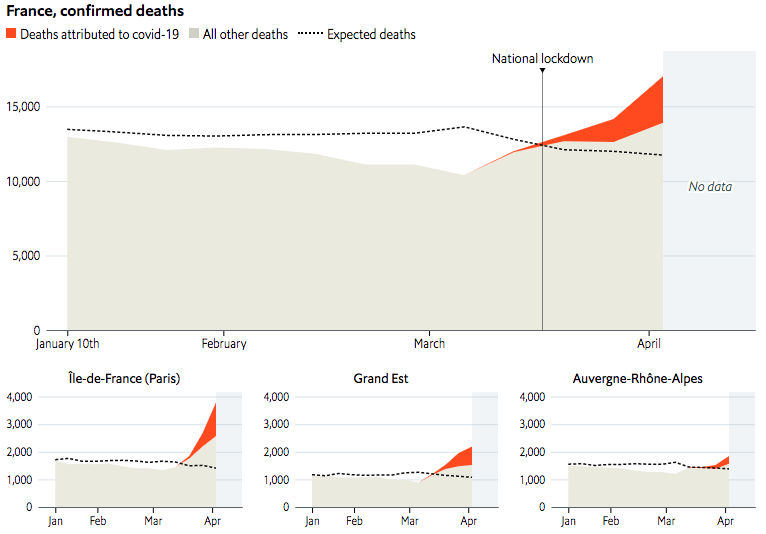
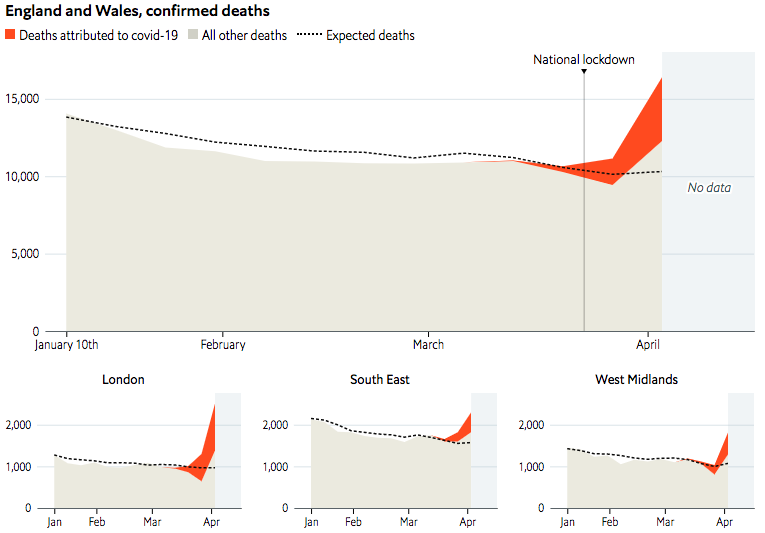
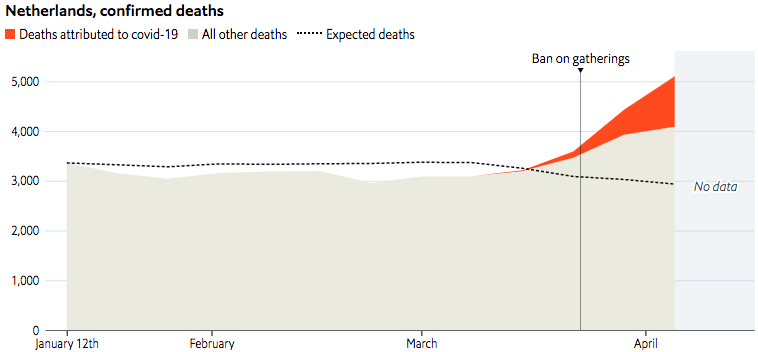
ParticipantSome more data about excess deaths, from James Tozer (at The Economist):
In Spain, data from @SaludISCIII suggest 13,000 excess deaths in March, compared to 8,000 official. Like Italy, Spain’s daily totals rely chiefly on data provided by hospitals, so might miss many victims who die elsewhere, or were not tested.
In France, we used data from @InseeFr, which show excess deaths of about 8,000 people by April 3rd. The official death toll from hospitals was about 5,000 at that point. Since April 1st, the health ministry has included deaths from care homes, causing a large rise.
In Britain, data from @ONS suggest excess deaths of about 7,000 in the four weeks to April 3rd. A revised count of covid cases—using death certificates, rather than daily data from hospitals—came to 6,200 in the same period.
In the Netherlands, data from @statisticscbs show a large undercount: 4,000 excess deaths in the four weeks to April 5th, vs 1,700 official at that point. This might explain why the current official toll of 3,100 is so low.
ParticipantAn interesting graph, showing the number of weekly Covid-19 deaths in New York is now much larger than the typical number of weekly deaths from all causes; with a comparison to the “deadliest recent flu season” (2017-2018):

Covid-19 deaths, starting from March 2. (Covid Tracking Project)
The 2017-18 flu season: This was the deadliest recent flu season.
The data begin on October 1, 2017, which the CDC considered the first week of that flu season. (CDC)All deaths from all causes for the same period as the 2017-18 flu season. (CDC)
https://www.thenewatlantis.com/publications/not-like-the-flu-not-like-car-crashes-not-like
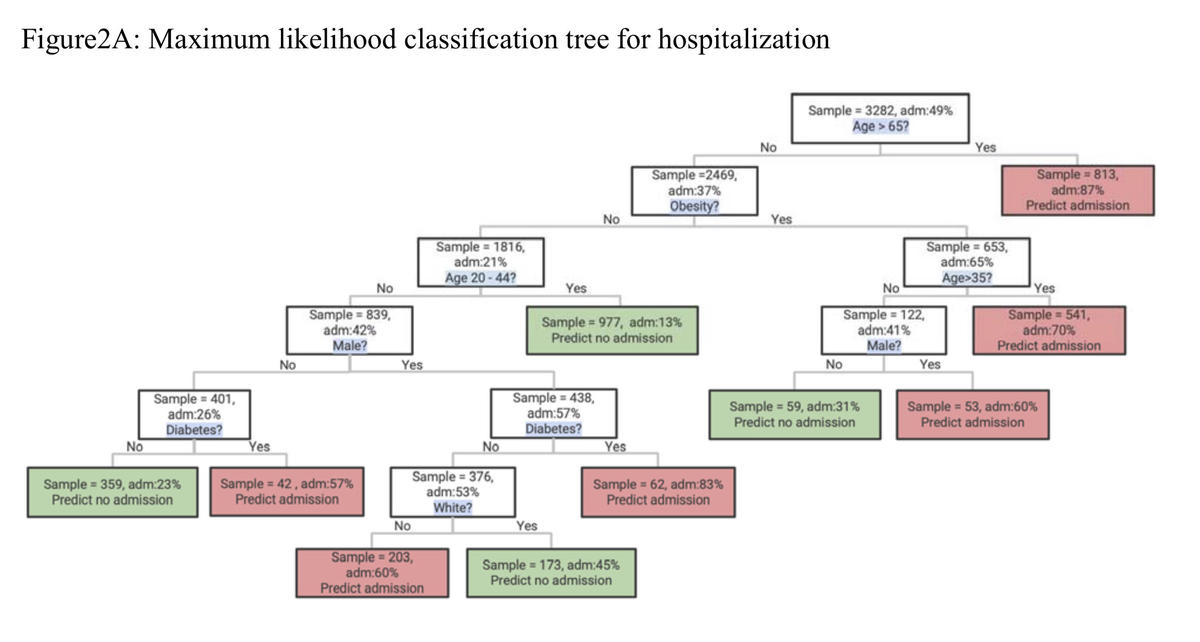
Participant• The Coronavirus Is Particularly Unkind To Those Who Are Obese (LAT)
…among those ages 65 and older, there was no link between obesity status and hospital careThe study actually concluded that Age >65 is a predictor of hospital admission (87% admitted), without making a distinction between the obese and non-obese in this age range.
For the people who are not in that Age >65 category, obesity was found to be a major factor in hospitalizations.
This is clearly shown in the related chart which Ilargi posted on April 13:
 Participant
Meanwhile,
Hot spots erupt in farm belt states where governors insist lockdowns aren’t needed
The only hospital in Grand Island, Neb., is full. The mayor has asked for a statewide stay-at-home order that the GOP governor insists isn’t needed. More than one-third of those tested for coronavirus in the surrounding county are positive — and there aren’t enough tests to go around.
Grand Island is the fourth-biggest city in a state President Donald Trump and his top health officials repeatedly name check for keeping the virus at bay without the strict lockdowns 42 other states have imposed.
https://www.politico.com/news/2020/04/15/coronavirus-hot-spots-farm-belt-189272
ParticipantWhat the models tell us, in New Zealand and elsewhere, seem pretty irrelevant to Ilargi’s argument (backed up by Nassim Taleb):
“…at some point [I] realized that the coronavirus is an issue you can’t leave to epidemiologists and virologists, because there are far too many unknowns for them to create a working model, and without such a model they are lost… These people are useful for the knowledge they possess of past epidemics, not for predicting what will happen in the next one, certainly not if it’s caused by a virus which they -and we- simply don’t know enough about to build a reliable model. In that case, you need to step back and apply more basic principles. Lucky for us, those exist.”
ParticipantFWIW,
As of today, Sweden’s death toll from Covid-19 (deaths per million of total population) is 30% higher than in the USA.
Source: Worldometer
ParticipantSpeaking of Sweden’s approach…
Sweden: 22 Scientists Say Coronavirus Strategy Has Failed As Deaths Top 1,000
(Forbes, April 14, 2020)In an opinion piece published today in Dagens Nyheter, the group of researchers from a range of top Swedish universities and research institutes make harsh criticism of the Swedish Public Health Agency and their present coronavirus strategy. They say that elected politicians must now intervene with “swift and radical measures.”
The researchers say the agency has claimed on four different occasions that the spread of infection has levelled out, despite evidence to the contrary. They point out the slowdown in infections and deaths in Finland, which has implemented much more restrictive measures.
Participant“Except for SARS-CoV and MERS-CoV, two deadly viruses that have caused outbreaks in the past, coronaviruses have been studied at laboratories that are labelled as operating at a moderate biosafety level known as BSL-2…”
I can’t vouch for authenticity, but this opening clip from the movie Outbreak walks us through fictional examples of labs operating at Biosafety Levels 1, 2, 3, and 4.
What looks like N95 masks are being used in the Biosafety Level 2 lab, while half-face respirators are used in the Level 3 lab.
Participant“For a facemask why wouldn’t people just use a half face 3m respirator…p95 and p100 filters are available.”
The P95 respirators (half face) are longer lasting than the N95. As I recall, the replaceable P95 filters are made to be used for an entire work week, while the N95 masks are meant to be used for one workday, at most.
But, the half face respirators typically have a valve that opens for the exhaling, which would eliminate a key benefit of mask wearing — protecting others from an infected mask wearer.
ParticipantIs there an increase in all-cause mortality?
Here’s some data from the National Vital Statistics System that looks at reported deaths from all causes, and compares it to the “Expected Deaths.” The Expected Deaths is the number of deaths during the same week of the previous 3 years, averaged. Percent of expected deaths is the number of deaths for all causes for this week in 2020 compared to the average number across the same week in 2017–2019. (This data is the total for all the weeks ending from 2/1/2020 to 3/28/2020.)
The numbers for New York City, and New York State (excluding NYC), are listed below. All of the other states have a “Percent of Expected Deaths” of less than 100%, meaning the total recorded deaths this year during that period are less than the average for that period during the past 3 years. New York City is the exception, with 110% of the expected deaths.
Table 3
Jurisdiction, Covid-19 Deaths, Deaths from All Causes, Percent of Expected Deaths
New York (excl. NYC) 180, 17,731, 96%
New York City 579, 10,970, 110%Note: Data during this period are incomplete because of the lag in time between when the death occurred and when the death certificate is completed, submitted to NCHS and processed for reporting purposes. This delay can range from 1 week to 8 weeks or more, depending on the jurisdiction, age, and cause of death.
Since the number of deaths for this year are incomplete due to this delay, the actual “Percent of Expected Deaths” will probably be higher than listed here.
ParticipantLooking at the CDC’s current data about underlying health conditions for Covid-19 patients, several aspects are striking.
(1) The data being submitted to the CDC is largely incomplete.
The total lab-confirmed cases (as of March 28) were 122,653. (Excluded are those who didn’t get tested to confirm a Covid-19 diagnosis.) Of the confirmed cases, the CDC received case report forms for only 60.7% of them (74,439). Of those 60.7% of cases for which the CDC got a case report form, only 7,162 had the data on underlying health conditions (and other risk factors). Thus, the CDC had data about underlying health conditions for only 5.8% of the lab-confirmed cases.(2) The CDC’s list of “underlying health conditions and other recognized risk factors” is large and surely covers a significant portion of the population. including conditions such as migraines, high blood pressure, arthritis…
Diabetes mellitus.
Chronic lung disease, including
asthma
chronic obstructive pulmonary disease (COPD)
emphysema.
Cardiovascular disease.
Immunocompromised condition.
Chronic renal disease.
Pregnancy.
Neurologic disorder, neurodevelopmental, intellectual disability, including
dementia, memory loss, or Alzheimer’s disease
seizure disorder
Parkinson’s disease
migraine/headache
stroke
autism
aneurysm
multiple sclerosis
neuropathy
hereditary spastic paraplegia
myasthenia gravis
intracranial hemorrhage
altered mental status.
Chronic liver disease.
Other chronic disease, including
hypertension
thyroid disease
gastrointestinal disorder
hyperlipidemia
cancer or history of cancer
rheumatologic disorder
hematologic disorder
obesity
arthritis, nonrheumatoid
musculoskeletal disorder other than arthritis
mental health condition
urologic disorder
cerebrovascular disease
obstructive sleep apnea
fibromyalgia
gynecologic disorder
embolism, pulmonary or venous
ophthalmic disorder
hypertriglyceridemia
endocrine
substance abuse disorder
dermatologic disorder
genetic disorder.
Former smoker.
Current smoker.(3) Yet, despite that long list of conditions, out of those confirmed Covid-19 cases which had data about underlying conditions, 62.4% of them had “none of the above conditions” (and the report forms were not just left blank for those conditions, they “were marked as not present”).
(4) Out of those cases with “none of the above conditions”, at least 84% of them were not hospitalized, and at least 2.2% of them were admitted to the ICU.
Preliminary Estimates of the Prevalence of Selected Underlying Health Conditions Among Patients with Coronavirus Disease 2019 — United States, February 12–March 28, 2020
Weekly / April 3, 2020
https://www.cdc.gov/mmwr/volumes/69/wr/mm6913e2.htmParticipantThinking about that $2 trillion stimulus package, I looked up some data to put this amount of dollars into perspective.
It’s more than the total amount of US dollars (physical currency) in circulation worldwide: $1.5 trillion.
It’s much more than the total value of the US gold reserves (at $1600/ounce): $418 billion.
It’s about half of the M1 Money Stock (“funds that are readily accessible for spending”) : $4 trillion
It’s less than 10% of the US national debt: $23 trillion
……………..
My calculation for the US gold reserve amounts to 261 million ounces, roughly one ounce of gold for every adult (over 18) in the US.
This makes me think about the inherent value of an ounce of gold, compared to $1600 of extra money that the government decides to print.
ParticipantYesterday, Dr D commented “I still think the [fatality] numbers are yet far lower, just as the flu is some 0.004% or something – it’s only “0.1%” against people in hospitals who bother to get tested.” and I wanted to address that (above), however obliquely.
To neoh’s concerns about trusting physicians,
“Not every mainstream medical professional is trying to lie about the flu. Most of these people, as a result of their indoctrination, simply assume conventional wisdom is true. But as you move toward the top of the ladder—for example, public health agencies like the US Centers for Disease Control (CDC)—there are definitely some first-class liars on board.”
written by Jon Rappoport, from the linked article provided by riestermParticipantAbout those deaths each year from the flu (in the US), the numbers aren’t what they seem. I was surprised to find the CDC numbers criticized on a .GOV website. Some highlights:
Prior to 2003, the data shows an average of only 1348 flu deaths per year (between 1979-2002). In 2003, an article in JAMA presented the results of a CDC model that calculated 36,155 deaths from “influenza associated underlying respiratory and circulatory causes“, but “less than a quarter of these (8097) were described as flu or flu associated underlying pneumonia deaths“. The author of the article explained that “influenza-associated mortality” is “a statistical association between deaths and viral data available.” He said that an association does not imply an underlying cause of death.” Yet somehow that 36,000 number was latched onto, and the statistics are now what comes out of a broadly-reaching model.
The CDC website states what has become commonly accepted and widely reported in the lay and scientific press: annually “about 36 000 [Americans] die from flu”…
Meanwhile, according to the CDC’s National Center for Health Statistics (NCHS), “influenza and pneumonia” took 62 034 lives in 2001—61 777 of which were attributed to pneumonia and 257 to flu, and in only 18 cases was flu virus positively identified.
Between 1979 and 2002, NCHS data show an average 1348 flu deaths per year (range 257 to 3006)…
CDC’s model [JAMA 2003] calculated an average annual 36 155 deaths from influenza associated underlying respiratory and circulatory causes. Less than a quarter of these (8097) were described as flu or flu associated underlying pneumonia deaths. Thus the much publicised figure of 36 000 is not an estimate of yearly flu deaths, as widely reported in both the lay and scientific press, but an estimate—generated by a model—of flu-associated death.
William Thompson of the CDC’s National Immunization Program (NIP), and lead author of the CDC’s 2003 JAMA article, explained that “influenza-associated mortality” is “a statistical association between deaths and viral data available.” He said that an association does not imply an underlying cause of death: “Based on modelling, we think it’s associated. I don’t know that we would say that it’s the underlying cause of death.” Yet this stance is incompatible with the CDC assertion that the flu kills 36 000 people a year—a misrepresentation that is yet to be publicly corrected.
At the 2004 “National Influenza Vaccine Summit,” co-sponsored by CDC and the American Medical Association, Glen Nowak, associate director for communications at the NIP, spoke on using the media to boost demand for the vaccine… Preceding the summit, demand had been low early into the 2003 flu season. “At that point, the manufacturers were telling us that they weren’t receiving a lot of orders for vaccine for use in November or even December,” recalled Dr Nowak on National Public Radio. “It really did look like we needed to do something to encourage people to get a flu shot.”
If flu is in fact not a major cause of death, this public relations approach is surely exaggerated. Moreover, by arbitrarily linking flu with pneumonia, current data are statistically biased. Until corrected and until unbiased statistics are developed, the chances for sound discussion and public health policy are limited.
https://aspe.hhs.gov/cdc-%E2%80%94-influenza-deaths-request-correction-rfc
ParticipantCorrection, should be:
200 million cases (known and unknown) would be reached sometime during the second week of May.Participant“Dr. Fauci, Trump’s main medical/epidemic advisor, said yesterday that 200,000 Americans could die from COVID19. The same Fauci, as I quoted two days ago, recently changed his case fatality rate prediction from 1% to 0.1%.”
As I mentioned in an earlier comment, Fauci didn’t actually predict a 0.1% CFR. But let’s go with that for now, to play with some more numbers. The total deaths in the US, from the chart above, is currently 2,438 rounded to 2,500. Assuming a CFR of 0.1%, the total number of cases currently in the US could be calculated as 2,500/0.1%= 2.5 million. (This would represent actual cases out there in the public, not just the recorded cases.)
So, at what point would the total cases in the US reach 200 million, to result in 200,000 deaths? If the number of cases doubles every week, next week we’d have 5 million cases, the week after that 10 million… and 200 million cases (known and unknown) would be reached sometime during the first week of May.
Again, this is just playing with numbers and assumptions. The curve will eventually “flatten” so that cases aren’t doubling every week.
ParticipantThat’s more exaggeration from “Tyler”.
I glanced at the APMEX site today, and many gold coins are still in stock, such as Krugerrands for $1,802.99 or the Austrian Philharmonic for $1,777.99
That’s less than 10% over the spot price.
https://www.apmex.com/product/13/austria-1-oz-gold-philharmonic-bu-random-year
Participant“And in case you doubted this, the cost of an American Eagle one ounce coin at the US Mint is now $2,175…”
The author’s credibility just went down. That coin sold by the US Mint is a proof coin sold at a premium price. New bullion coins (not proof) can be found for around $1,800 per ounce (with a spot price of $1,658).
How to Buy United States Mint Bullion Coins
The United States Mint, like other world mints, does not sell its bullion coins directly to the public. Instead, we distribute our coins through a network of official distributors called “authorized purchasers” who, in turn, create a two-way market buying and selling to precious metals wholesalers, private investors, and local bullion coin dealers.This method provides effective and efficient distribution, which maximizes the availability of a two-way market of United States Mint Bullion Coins in retail markets and major investment markets.
United States Mint bullion coins are sold based on the prevailing market price of gold, silver, platinum, or palladium plus a small premium to cover minting, distribution, and marketing costs.
https://catalog.usmint.gov/coins/precious-metal-coins/bullion-coins.html
ParticipantDidn’t see much written about this:
Negative rates come to the US: 1-month and 3-month Treasury bill yields are now below zero
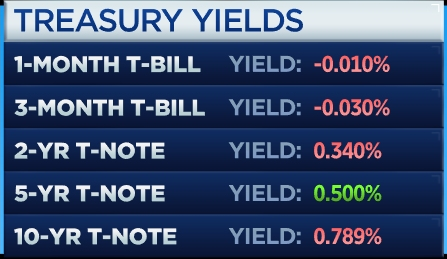
CNBC, March25, 2020Apocalypse Now: U.S. Treasury Bond Yields Now Have Negative Rates
“Investors just issued a terrifyingly bleak vote of no confidence in the American economy by crowding Treasury bond yields to negative rates. Consider what that means for the future of the American economy. Rather than buy equities at a steep discount, they’re piling into Treasury bonds with negative rates. That means they think they’ll get their money back, or even make a profit selling it to the next investor.”
“That means financial markets just issued a terrifyingly bleak vote of no confidence in the U.S. economy. We’re facing a recession ahead unlike any living American has seen in their life time.”
https://www.ccn.com/apocalypse-now-u-s-treasury-bond-yields-now-have-negative-rates/
Participant• Dr. Fauci: Coronavirus Death Rate Like Very Bad Flu (WND)
Be careful, this is a misleading headline. In his editorial piece in the NEJM (with the CDC’s Robert Redfield as one of the co-authors), what Fauci wrote is that if one assumes that unreported cases are several times higher than reported cases, then the case fatality rate may be considerably less than 1%, which suggests that Covid-19 may be more akin to influenza (which has a CFR of 0.1%) rather than a disease like SARS or MERS (which had a CFR of 10% and 36%, respectively).
So, Dr. Fauci’s opinion is that Covid-19’s fatality rate may be considerably less than 1%, and may be closer to 0.1% than 10%. He’s not even saying that he thinks Covid-19’s fatality rate will probably be considerably less than 1%. And he’s not actually claiming that it will be like a severe case of the flu.
In another article in the Journal, Guan et al. report mortality of 1.4% among 1099 patients with laboratory-confirmed Covid-19; these patients had a wide spectrum of disease severity. If one assumes that the number of asymptomatic or minimally symptomatic cases is several times as high as the number of reported cases, the case fatality rate may be considerably less than 1%. This suggests that the overall clinical consequences of Covid-19 may ultimately be more akin to those of a severe seasonal influenza (which has a case fatality rate of approximately 0.1%) or a pandemic influenza (similar to those in 1957 and 1968) rather than a disease similar to SARS or MERS, which have had case fatality rates of 9 to 10% and 36%, respectively.
Participant“The losses in the stock “markets” lately have been staggering, trillions were lost. But then you look at a graph and you think holy sh*t, there’s so much more to go, so much more downside…”
Yessir, we’re only down to the 2017 bubble level, which was so overpriced and teetering at the time that David Stockman was warning about a 40% drop from that level.
ParticipantJohn Day, your clinic might be able to order “COVID-19 Rapid Test Cassettes” from the UK manufacturer:
https://www.surescreen.com/products/covid-19-coronavirus-rapid-test-cassette
Benefits Of Our COVID-19 Rapid Test Cassette
Significant time and cost saving over lab methods
Results within 10 minutes
Identifies infection even in mild or asymptomatic cases
Assists in the control of viral transmission
Screen anywhere
Ideal as a triage and screening tool
Accuracy of 97.8% (IgM) and 99.6% (IgG)
Easy to use and read, with no specialist equipment required“Get in touch to order your COVID-19 Rapid Test Cassettes: Contact Us“
Please note: Our COVID-19 rapid test is only available to business customers. We are not able to supply to private individuals at this moment.ParticipantMeanwhile, a clinical trial to see whether chloroquine can prevent Covid-19 is slated to begin in May 2020, with the study completion date in May 2022.
Official Title: Chloroquine Prevention of Coronavirus Disease (COVID-19) in the Healthcare Setting; a Randomised, Placebo-controlled Prophylaxis Study (COPCOV)
Estimated Study Start Date : May 2020
Estimated Primary Completion Date : May 2022
Estimated Study Completion Date : May 2022ParticipantRegarding chloroquine and Covid-19, last week an article was published by a medical journal, recommending that clinical trials be done for HCQ (hydroxychloroquine) instead of CQ (chloroquine), for reasons including fewer side effects and safety during pregnancy.
COVID-19: a recommendation to examine the effect of hydroxychloroquine in preventing infection and progression
Dan Zhou, Sheng-Ming Dai, Qiang Tong
Journal of Antimicrobial Chemotherapy, Published: 20 March 2020
https://academic.oup.com/jac/advance-article/doi/10.1093/jac/dkaa114/5810487Gastrointestinal responses, such as vomiting and diarrhoea, are the most common adverse effects of these two drugs. Patients with long-term exposure to CQ suffer from severe side effects, such as retinopathy, circular defects (or bull’s eye maculopathy), diametric defects in the retina and cardiomyopathy. Elderly patients and usage beyond dosage limits are also associated with toxicities of CQ therapy. In contrast, HCQ has a lower level of tissue accumulation, which may explain the fact that it is associated with fewer adverse events than CQ, but still potentially influences the prevention and treatment of malaria to a similar level. Indeed, only high-dose and long-term (over 5 years) intake of HCQ is likely to contribute to the development of retinopathy, which is in agreement with the current preference of HCQ use in therapy. While CQ exerts a number of severe side effects on fetal development, HCQ is strongly recommended for pregnant patients with an autoimmune disease as it prevents the development of congenital heart block due to a potential inhibitory effect of type I interferon production. The outbreak of SARS-CoV-2 has placed many pregnant women at high risk of infection (several infected cases have been reported); HCQ, rather than CQ, should be considered as a potential therapeutic solution for these patients, given its safety profile in pregnancy. More importantly, the maximum tolerable dose for HCQ is 1200 mg, which has an antiviral effect equivalent to 750 mg CQ (for which the maximum tolerable dose is 500 mg). This indicates that HCQ can be administered at a higher dosage and may therefore achieve a more powerful antiviral effect.
ParticipantUpdate on the Boeing soap opera:
Boeing has options to federal bailout, CEO says
By the Leeham News Staff, March 25, 2020
https://leehamnews.com/2020/03/25/hotr-boeing-has-options-to-federal-bailout-ceFirst, Boeing CEO David Calhoun said he wasn’t an insider (after 10 years on the Board of Directors, and as lead director for many of them). No, he merely had a front row seat in the movie theatre. Then he trashed his predecessor, Dennis Muilenburg, for stock buyback and dividend policies (that the Board approved).
Next, Boeing said it needs a portion of the $60bn in federal aid it requested for the aerospace industry.
Now, Calhoun appears to have put his foot in his mouth again. Or did he? When asked about the possibility of the government taking an equity position in Boeing as a condition to a bailout, Calhoun said Boeing has options to federal money.
The Wall Street Journal wrote yesterday, “I don’t have a need for an equity stake,” Boeing CEO Calhoun said Tuesday on Fox Business Network. “If they forced it, we’d just look at all the other options, and we have got plenty.”
There’s a very practical reason for Boeing to object to government taking an equity stake. It would effectively shut down bidding on some key defense contracts.
But wait a minute: if you’ve got all these other options, why ask for a federal bailout for Boeing?
Participant“An Arizona man has died after ingesting chloroquine phosphate…”
On Feb 28, John Day quoted here an article listed at PubMed (National Institute of Health) which recommended chloroquine phosphate.
“…recommended chloroquine phosphate tablet, 500mg twice per day for 10 days for patients diagnosed as mild, moderate and severe cases of novel coronavirus pneumonia and without contraindications to chloroquine.”
https://www.ncbi.nlm.nih.gov/pubmed/32164085Chloroquine phosphate, in some form, is/was available online without a prescription. As one aquarium supply website puts it:
It is typically unavailable to the majority of the reefing community due to it normally being available only through a Veterinarian via a prescription. I feel your pain if you are like me and tried to get Chloroquine phosphate from a veterinarian. It is difficult to obtain, so I have worked with a national laboratory to obtain a 99% pure Cholorquine Phosphate solution…
ParticipantWith the coronavirus getting so much attention, I missed this news. Earlier this year, the US reversed its ban on landmines. (Meanwhile, 164 countries, including all other NATO members, adhere to the Mine Ban Treaty.)
But don’t worry, the new ones are “smart” landmines.
A January 31, 2020 memo by Defense Secretary Mark Esper reverses a 2014 ban on US production and acquisition of antipersonnel landmines, as well as their use outside of a future conflict on the Korean Peninsula. The policy decision nullifies years of steps by the US to align its policy and practice with the 1997 treaty banning antipersonnel landmines…
The Mine Ban Treaty, which entered into force on March 1, 1999, comprehensively prohibits antipersonnel mines and requires their clearance, destruction of stockpiles, and assistance to mine victims. A total of 164 countries have joined the Mine Ban Treaty, including all other NATO members and the US allies Australia and Japan. The US participated in the 1996-1997 Ottawa Process to negotiate the treaty, but never adopted or signed it.
https://www.hrw.org/news/2020/02/27/us-revisit-landmines-decision
Modern land mine designs include a deactivation mechanism, which is supposed to kick in after a period of time, between, say, 12 hours and 60 days. The minefields are also “smart,” in that they can “talk to each other and be command-activated, and link into other sensors so that they know when enemy formations are coming”…
But reducing the threat does not mean eliminating it, notes a U.S. Campaign to Ban Landmines statement released last week by 63 nongovernmental organizations that came together to condemn the policy. “If the self-destruct or self-deactivation mechanisms were to fail, they would remain lethal, and the potential exists for the components to be repurposed into improvised explosive devices…”
ParticipantThe Coronavirus Did Not Escape From A Lab. Here’s How We Know. (LiveScience)
Here’s how they “know”: A letter to the editor (“Correspondence”, which is typically not peer-reviewed) was published by the journal Nature. The summary states, unequivocally, “Our analyses clearly show that SARS-CoV-2 is not a laboratory construct or a purposefully manipulated virus.” Yet, their evidence only shows that SARS-CoV-2 is probably not a laboratory construct or a purposefully manipulated virus.
Examples of their not-so-definitive findings:
“Thus, the high-affinity binding of the SARS-CoV-2 spike protein to human ACE2 is most likely the result of natural selection on a human or human-like ACE2 that permits another optimal binding solution to arise.”
“It is improbable that SARS-CoV-2 emerged through laboratory manipulation of a related SARS-CoV-like coronavirus.”
“Furthermore, if genetic manipulation had been performed, one of the several reverse-genetic systems available for betacoronaviruses would probably have been used.”
“However, since we observed all notable SARS-CoV-2 features, including the optimized RBD and polybasic cleavage site, in related coronaviruses in nature, we do not believe that any type of laboratory-based scenario is plausible.”
ParticipantMentions obesity as being the most frequent co-morbidity, and the use of chloroquine and hydroxychloroquine as treatment.
Handling Critical CoVid-19 Patients: a Guide from Italian Anesthesiologists
Italian-American doctors translate advice from anesthesiologists who’ve been saving lives for several weeks in ItalyItalian anesthesiologists have been handling critical coronavirus patients in Italy for several weeks. They shared their experience in a video-conference whose salient points were captured in a summary. We translated that summary, hoping that professionals around the world will find this information valuable as they face similar challenges in the days to come.
GiViTI COVID19 MEETING 10 March 2020 –
ICU PATIENTS
Patient CharacteristicsThe average age of patients is about 70 years old.
The most frequent co-morbidity is OBESITY.
…
Pharmacologic TherapyLopinavir/ritonavir (KALETRA) 200/50 mg po BID.
Chloroquine 500 mg po BID or hydroxychloroquine 200 mg po BID.
Prophylactic antibiotics (variable according to local practice: piperacillin/tazobactam, ceftriaxone, TMP/SMX, antifungals (the use of azithromycin has been abandoned).
Acetylcysteine 300 mg po TID (secretions not abundant, but dense when present).
Steroids? Only in cases with fibrosis (do not use prematurely).
Tocilizumab? IL-6 receptor inhibitor. Rationale is vast inflammation BUT use must be evaluated in setting of lymphopenia. At the moment NO indication for routine use and NO precocious use.Participantboilingfrog, I dunno, as you said it’s still the early innings.
Just now checked the latest Worldometer numbers, the deaths in the US (as a percentage of total cases) is still around 1.3%, while in the UK it’s increased to 5.7%. And this is the death rate “before the NHS becomes overwhelmed and is unable to cope” (quoted from the article below).
Coronavirus: Deaths rising faster in UK than Italy
The death toll in Italy from Covid-19 has now exceeded total deaths in China – the source of the outbreak. Could the UK be on the same path?…Meanwhile the number of deaths in the UK continue to rise. It has now been two weeks since the first confirmed death from coronavirus in the UK – and since then the number who have died has been rising at a faster rate than in Italy.
It highlights the urgency needed to arrest the spread of the disease before the NHS becomes overwhelmed and is unable to cope.
https://www.telegraph.co.uk/news/2020/03/19/coronavirus-deaths-rising-faster-uk-italy/
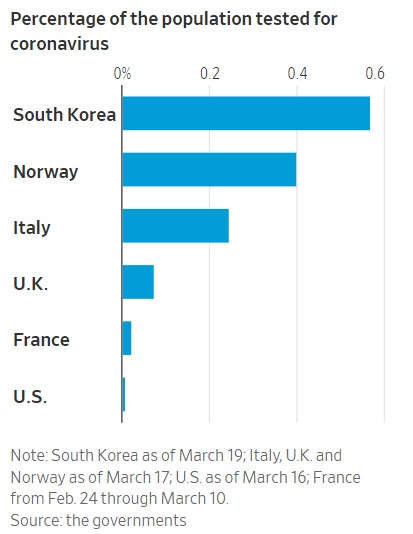
ParticipantThat Worldometer chart (above) shows that the UK and US both have 59 cases per million population. However, the number of deaths as a percentage of total cases is quite different for these two countries: 1.3% for the US, and 4.4% for the UK.
In other words, the death rate in the UK, as a percentage of total cases, is more than 3 times the death rate in the US. Perhaps this could be explained If the US was testing more and identifying more (mild) cases, but this chart (from Ilargi, above) shows that the UK is testing a lot more of its population that the US.
-
AuthorPosts