

It's time we do away with the notion behind the incessant flow of stories and warnings about upcoming hyperinflation in the US. It can't and therefore won't happen, at least not for years into the future. It would be a lot more constructive – and necessary – to focus on the reality we see before us than on such a purely mythological tale. Because that's all it is. Bubbles, and yes, that includes credit bubbles, have their own internal dynamics: they MUST pop when they reach critical mass.
Trying to prevent the pop, or even increase that mass, is futile. And even though that may be more about physics than about finance, why it is so hard to understand is beyond me. The deleveraging, a.k.a. debt deflation, has hardly begun, and it for now remains largely hidden behind a veil of QEs. That doesn't negate the fact that ultimately QE is powerless to stop it, even as it sure manages to fool a lot of people into thinking it can.
But don't take my word for it. You could start with – even – the IMF saying European banks will need to sell $4.5 trillion in assets through 2013. And then try to explain how that could possibly link to hyperinflation. For now: never mind.
Puru Saxena wrote a good piece on the topic recently, here are a few excerpts:
The world’s major economies are struggling and their private-sector is deleveraging (paying off debt). If history is any guide, this deflationary process is likely to continue for several years.
You will recall that heading into the global financial crisis, corporations and households in the developed world were leveraged to the hilt. During the pre-crisis era, debt was considered a birth right and for decades, the private-sector leveraged its balance-sheet. Unfortunately, when the US housing market peaked and Lehman went bust, asset values plummeted but the liabilities remain unchanged. Thus, for the first time in their lives, people in the developed world experienced the wrath of excessive leverage.
Today, the private-sector in the West is struggling and for the vast majority of households, their liabilities now exceed their assets. Furthermore, incomes have also declined (or vanished), thereby making the debt servicing even more difficult. Consequently, in order to avoid bankruptcy, the private-sector in the developed world is now trying its best to reduce its debt overhang. Instead of getting excited by near-zero interest rates and taking on even more debt, it is now doing the unthinkable and paying off its liabilities.
Figure 1 shows that despite the Federal Reserve’s carrot of almost free credit, the private-sector in the US is deleveraging. As you can see, since the bursting of the housing bubble, America’s companies and households have been accumulating large surpluses. Make no mistake, it is this deleveraging which is responsible for the sluggish economic activity in much of the developed world. Furthermore, this urge to repay debt is the real reason why monetary policy in the West has become ineffective.
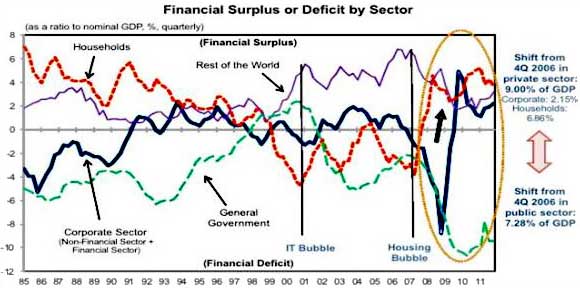
Figure 1: America’s private-sector is not playing Mr. Bernanke’s game. Source: Nomura
If you review data, you will note that in addition to the US, most nations in Western Europe are also deleveraging and this explains why the continent’s economy is on its knees.
The truth is that such periods of deleveraging continue for several years and when the private-sector decides to repay debt, interest rates remain subdued and monetary policy becomes ineffective. Remember, during a normal business cycle, monetary easing succeeds in igniting another wave of leverage. However, when the private-sector is already leveraged to the hilt and it is dealing with negative equity, low interest rates fail to kick start another credit binge.
As much as Mr. Bernanke would like to ignore this reality, it is clear to us that this is where the developed world stands today. Furthermore, this ongoing deleveraging is the primary reason why the Federal Reserve’s stimulus has failed to increase America’s money supply or unleash high inflation. Figure 2 shows that over the past 4 years, the US monetary base has grown exponentially, yet this has not translated into money supply or loan growth.

Figure 2: Liquidity injections have failed to increase US money supply. Source: Nomura
At this stage, it is difficult to forecast when the ongoing deleveraging will end. However, we suspect that the private-sector may continue to pay off debt for at least another 4-5 years. In our view, unless the US housing market improves and real-estate prices rise significantly, American households will not be lured by record-low borrowing costs. Furthermore, given the fact that tens of millions of baby boomers are approaching retirement age, we believe that the ongoing deleveraging will not end anytime soon. Due to this rare aversion to debt, interest rates in the West will probably remain low for several years. [..]
Once you realize just how enormous that gap is (see that last graph) between the monetary base vs the money supply, and the seemingly smaller gap between monetary base vs loans and leases, maybe then you see a light a-shinin'. Maybe you never thought about things that way before, or maybe you never saw it in a graph, and you needed to see that. It surely carries a very large argument against hyperinflation.
Puru Saxena thinks there are positive signs in US housing numbers, that there's a bottom, and he's certainly not the only one; that's one train everyone seems to be eager to jump on.
I’m sorry, but I think the recent alleged US housing recovery is a proverbial soap bubble. In the article below, Tyler Durden at ZH calls it a "subsidized bounce". He also says: "two concurrent housing bubbles can not happen", and he may well be right, but if he is, it means that perhaps what we see is a bubble within a bubble, a mother and child bubble, instead of two concurrent ones. Durden brings interesting numbers and developments to the forefront. It would be good if more people digest them, and only then decide whether this is a recovery or not.
US households are not merely deleveraging, and taken as a whole you could perhaps make a point that they're not at all. They go one step beyond deleveraging: they're simply and plainly defaulting.
US Households Are Not "Deleveraging" – They Are Simply Defaulting In Bulk
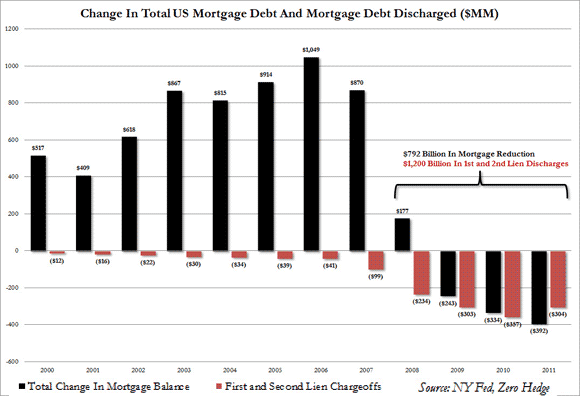
Lately there has been an amusing and very spurious, not to mention wrong, argument among both the "serious media" and the various tabloids, that US households have delevered to the tune of $1 trillion, primarily as a result of mortgage debt reductions (not to be confused with total consumer debt which month after month hits new record highs, primarily due to soaring student and GM auto loans). The implication here is that unlike in year past, US households are finally doing the responsible thing and are actively deleveraging of their own free will.
This couldn't be further from the truth, and to put baseless rumors of this nature to rest once and for all, below we have compiled a simple chart using the NY Fed's own data, showing the total change in mortgage debt, and what portion of it is due to discharges (aka defaults) of 1st and 2nd lien debt. In a nutshell: based on NYFed calculations, there has been $800 billion in mortgage debt deleveraging since the end of 2007. This has been due to $1.2 trillion in discharges (the amount is greater than the total first lien mortgages, due to the increasing use of HELOCs and 2nd lien mortgages before the housing bubble popped).
In other words, instead of actual responsible behavior of paying down debt, the primary if not only reason there has been any "deleveraging" at all at the US household level, is because of excess debt which became insurmountable, not because it was being paid down, the result of which is that more and more Americans are simply handing their keys in to the bank and walking away, and also explains why the US banking system is now practicing Foreclosure Stuffing, as defined first here, as the banks know too well, if all the housing inventory which is currently in the default pipeline were unleashed, it would rip off any floor below the US housing "recovery" which is not a recovery at all, but merely a subsidized bounce, as millions of units are held on the banks' books in hopes that what limited inventory there is gets bid up so high the second housing bubble can be inflated before the first one has even fully burst.
Naturally, two concurrent housing bubbles can not happen, Bernanke's fondest wishes to the contrary notwithstanding, especially since as shown above, US households do not delever unless they actually file for bankruptcy, and in the process destroy their credit rating for years, making them ineligible for future debt for at least five years.
It is thus safe to say that all the other increasingly poorer US households [..] are merely adding on more and more debt in hopes of going out in a bankrupt blaze of glory just like everyone else: from their neighbors, to all "developed world" governments. And why not: after all this behavior is being endorsed by the Fed with both hands and feet.
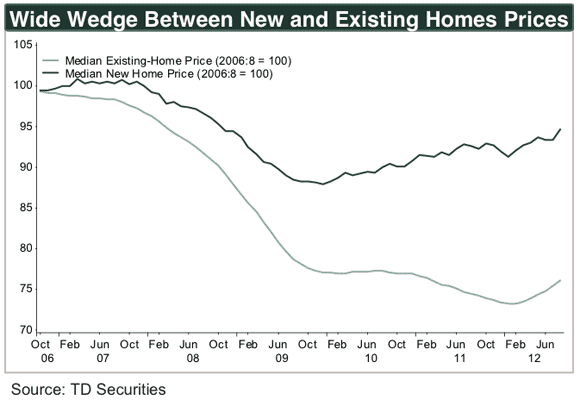
The following graph from TD Securities ( through Sam Ro at BI ) makes a good case for the "subsidized bounce" definition Durden applies to the present US housing market. It's no secret there's a huge shadow inventory overhanging US housing, and now it comes out that those great new home numbers are not what everybody would like to think they are.
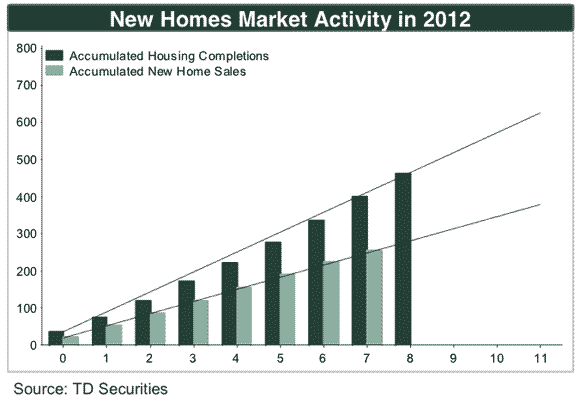
Many more houses are built than sold. And get shoved on top of the pile that's already there, both the shadow inventory and the out of the closet one. Which begs the question: how long does a home stay in the "new" category? Does it take 1 year of staying empty for it to move to "existing"? 2 years, 3 years? 5? For one thing, builders and developers certainly have a huge incentive to continue to advertise it as new.
A graph from the same source:
How this constitutes a recovery I just can't fathom. I think that is just something people would like so much to see that they actually see it. Moreover, there remains the issue that it's very hard for most to comprehend what debt deflation is, what its dynamics are, and what consequences it has.
We have lived through the by far biggest credit bubble in history. It should be clear to everyone that this bubble has not fully – been – deflated yet (and if it's not, good luck). Until it has, economic recovery and housing recovery are pipedreams. And so is hyperinflation, though that may be more of a pipe nightmare. There is no way QE, or money printing, or whatever you name it, can cause hyperinflation against the tide of a deflating bubble. Once a bubble has fully burst, it is a possibility. But only then. And only if and when a country has become unable to borrow in international debt markets. Greece perhaps soon, but for the US it's years away, if ever.
Darrel Whitten at iStockAnalyst has more:
QE Not Preventing Slowest Growth Since 2009 Recession
QE Ad Infinitum: Why QE is Not Reviving Growth
In a speech in November of 2002, Fed chairman Ben Bernanke made the now infamous statement, "the U.S. government has a technology, called the printing press, that allows it to produce as many U.S. dollars as it wishes essentially at no cost," thus earning the nickname "Helicopter Ben". Then, he was "confident that the Fed would take whatever means necessary to prevent significant deflation", while admitting that "the effectiveness of anti-deflation policy would be significantly enhanced by cooperation between the monetary AND fiscal authorities."
Five years after the 2008 financial crisis, Helicopter Ben undoubtedly has a greater appreciation for the issues the BoJ faced in the 1990s. The US 10-year treasury bond (as well as global bond) yields have been in a secular decline since 1980 and hit new historical lows after the crisis. What the bond market has been telling us even before the QE era is that bond investors expect even lower sustainable growth as well as ongoing disinflation/deflation, something that Helicopter Ben has been unable to eradicate despite unprecedented Fed balance sheet deployment.
A Broken Monetary Transfer Mechanism
Effective monetary policy is dependent on the function of what central bankers call the Monetary Transmission Mechanism, where "central bank policy-induced changes in the nominal money stock or the short-term nominal interest rate impact real economy variables such as aggregate output and employment, through the effects this monetary policy has on interest rates, exchange rates, equity and real estate prices, bank lending, and corporate balance sheets."
Yet two monetary indicators, i.e., the money multiplier and the velocity of money clearly demonstrate that the plumbing of this monetary transmission mechanism is dysfunctional. In reality, the modern economy is driven by demand-determined credit, where money supply (M1, M2, M3) is just an arbitrary reflection of the credit circuit. As long as expectations in the real economy are not affected, increases in Fed-supplied money will simply be a swap of one zero-interest asset for another, no matter how much the monetary base increases. Thus the volume of credit is the real variable, not the size of QE or the monetary base.
Prior to 2001, the Bank of Japan repeatedly argued against quantitative easing, arguing that it would be ineffective in that the excess liquidity would simply be held by banks as excess reserves. They were forced into adopting QE between 2001 and 2006 through the greater expedient of ensuring the stability of the Japanese banking system. Japan's QE did function to stabilize the banking system, but did not have any visible favorable impact on the real economy in terms of demand for credit. Despite a massive increase in bank reserves at the BoJ and a corresponding increase in base money, lending in the Japanese banking system did not increase because: a) Japanese banks were using the excess liquidity to repair their balance sheets and b) because both the banks and their corporate clients were trying to de-lever their balance sheets.
Further, instead of creating inflation, Japan experienced deflation, and these deflationary pressures continue today amidst tepid economic growth. This process of debt de-leveraging morphing into tepid long-term, deflationary growth with rapidly rising government debt is now referred to as "Japanification".
Two Measures of Monetary Policy Effectiveness
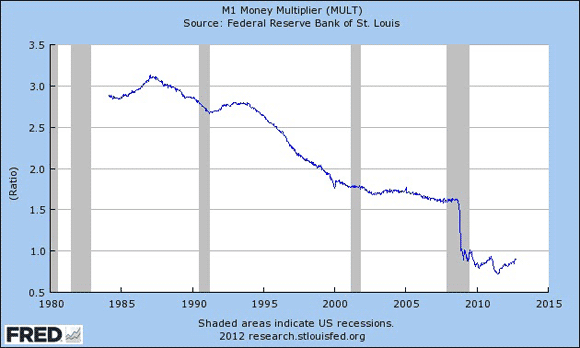
(1) The Money Multiplier. The money multiplier is a measure of the maximum amount of commercial bank money (money in the economy) that can be created by a given unit of central bank money, i.e., the total amount of loans that commercial banks extend/create. Theoretically, it is the reciprocal of the reserve ratio, or the amount of total funds the banks are required to keep on hand to provide for possible deposit withdrawals.
Since September 2008, the quantity of reserves in the U.S. banking system has grown dramatically. Prior to the onset of the financial crisis, required reserves were about $40 billion and excess reserves were roughly $1.5 billion. Following the collapse of Lehman Brothers, excess reserves exploded, climbing to $1.6 trillion, or over 10X "normal" levels. While required reserves also over this period, this change was dwarfed by the large and unprecedented rise in excess reserves. In other words, because the monetary transfer mechanism plumbing is stopped-up, monetary stimulus merely results in a huge build-up of bank reserves held at the central bank.
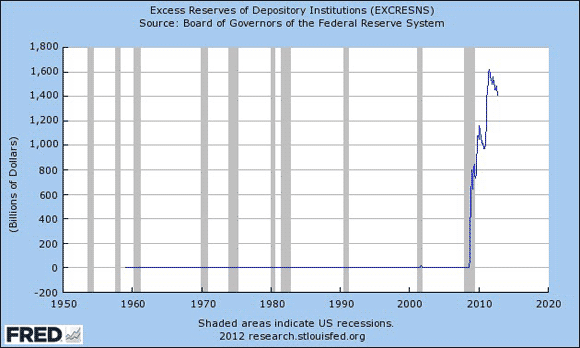
If banks lend out close to the maximum allowed by their reserves, then the amount of commercial bank money equals the amount of central bank money provided times the money multiplier. However, if banks lend less than the maximum allowable according to their reserve ratio, they accumulate "excess" reserves, meaning the amount of commercial bank money being created is less than the central bank money being created. As is shown in the following FRED chart, the money multiplier collapsed during the 2008 financial crisis, plunging from from 1.5 to less than 0.8.
Further, there has been a consistent decline in the money multiplier from the mid-1980s prior to its collapse in 2008, which is similar to what happened in Japan. In Japan, this long-term decline in the money multiplier was attributable to a) deflationary expectations, and b) a rise in the ratio of cash in the non-financial sector. The gradual downtrend of the multiplier since 1980 has been a one-way street, reflecting a 20+ year dis-inflationary trend in the U.S. that turned into outright deflation in 2008.
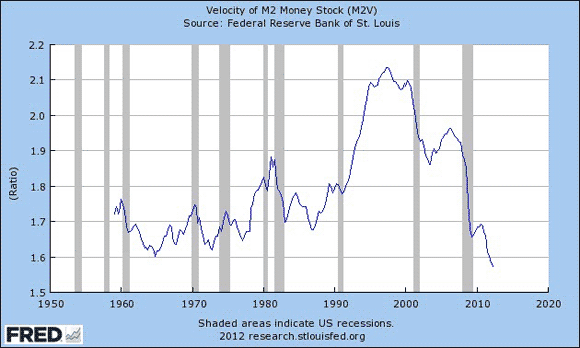
(2) The Velocity of Money. The velocity of money is a measurement of the amount of economic activity associated with a given money supply, i.e., total Gross Domestic Product (GDP) divided by the Money Supply. This measurement also shows a marked slowdown in the amount of activity in the U.S. economy for the given amount of M2 money supply, i.e., increasingly more money is chasing the same level of output. During times of high inflation and prosperity, the velocity of money is high as the money supply is recycled from savings to loans to capital investment and consumption.
During periods of recession, the velocity of money falls as people and companies start saving and conserving. The FRED chart below also shows that the velocity of money in the U.S. has been consistently declining since before the IT bubble burst in January 2000—i.e., all the liquidity pumped into the system by the Fed from Y2K scare onward has basically been chasing its tail, leaving banks and corporates with more and more excess, unused cash that was not being re-cycled into the real economy.
Monetary Base Explosion Not Offsetting Collapsing Money Multiplier and Velocity
The wonkish explanation is BmV = PY, (where B = the monetary base, m = the money multiplier, V = velocity of money), PY is nominal GDP. In other words, the massive amounts of central bank monetary stimulus provided by the Fed and other central banks since the 2008 financial crisis have merely worked to offset the deflationary/recessionary impact of a collapsing money multiplier and velocity of money, but have not had a significant, lasting impact on nominal GDP or unemployment.
The only verifiable beneficial impact of QE, as in the case of Japan over a decade ago and the U.S. today is the stabilization of the banking system. But it is clear from the above measures and overall economic activity that monetary policy actions have been far less effective, and may even have been detrimental in terms of deflationary pressures by encouraging excess bank reserves. Until the money multiplier and velocity of money begin to re-expand, there will be no sustainable growth of credit, jobs, consumption, housing; i.e., real economic activity. By the same token, the speed of the recovery is dependent upon how rapidly the private sector cleanses their balance sheets of toxic assets.
QE falls into a black hole. And it leads into an – if possible even larger – black hole. Ben Bernanke and Mario Draghi have neither the power nor the tools to stop deleveraging and debt deflation. That's just a myth they, and many with them who stand to benefit from that myth, like you to continue believing. It makes it all that much easier for them.
That surge in excess bank reserves (see the second graph above) comes from QE. It is your money, everyone's money. And it does nothing to "heal" the economy you live in and depend on for your survival; it just takes away more of it all the time. That is the one thing Ben and Mario have power over: they can give money away that you will have to pay for down the line. They can lend it out to banks knowing that it will never be repaid, and not care one inch. Knowing meanwhile that you won't either, because you don't look at what's down the line, you look at today, and today everything looks fine. Except for that graph, perhaps, but hey, how many people are there who understand what it says?
One thing Ben and Mario can not do, however, is create hyperinflation. They can't even truly create any type of real inflation (which is money/credit supply x velocity vs goods and services), for that matter. They're stuck as much as you yourself are in the dynamics of this bursting bubble.
At The Automatic Earth, Nicole – Stoneleigh – Foss and I have been saying for years that deleveraging and debt deflation are an inevitable consequence of what went before and an equally inevitable precursor of anything that may come after. And I have often said that the deleveraging will be so severe that what may come after is only moderately interesting, since you won't hardly recognize your world once deflation has run its course. Apparently this is hard to understand, the hyperinflation myth just won't die. What can I say? Time to get serious.
Home › Forums › US Hyperinflation Is A Myth