Roger Viollet Great Paris Flood, Gare Saint-Lazare 1910

Bubble, anyone?
• Goldman Warns Highest Market Valuations Since 1900 Mean Pain Is Coming (BBG)
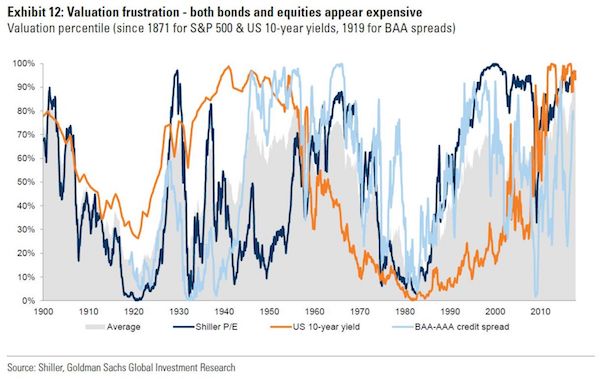
A prolonged bull market across stocks, bonds and credit has left a measure of average valuation at the highest since 1900, a condition that at some point is going to translate into pain for investors, according to Goldman Sachs. “It has seldom been the case that equities, bonds and credit have been similarly expensive at the same time, only in the Roaring ’20s and the Golden ’50s,” Goldman Sachs International strategists including Christian Mueller-Glissman wrote in a note this week. “All good things must come to an end” and “there will be a bear market, eventually” they said. As central banks cut back their quantitative easing, pushing up the premiums investors demand to hold longer-dated bonds, returns are “likely to be lower across assets” over the medium term, the analysts said.
A second, less likely, scenario would involve “fast pain.” Stock and bond valuations would both get hit, with the mix depending on whether the trigger involved a negative growth shock, or a growth shock alongside an inflation pick-up. “Elevated valuations increase the risk of draw-downs for the simple reason that there is less buffer to absorb shocks,” the strategists wrote. “The average valuation percentile across equity, bonds and credit in the U.S. is 90%, an all-time high.” A portfolio of 60% S&P 500 Index stocks and 40% 10-year U.S. Treasuries generated a 7.1% inflation-adjusted return since 1985, Goldman calculated – compared with 4.8% over the last century. The tech-bubble implosion and global financial crisis were the two taints to the record.
Low inflation has prevailed in the current period, just as it did alongside economic growth in the 1920s and 1950s, according to the Goldman report. “The worst outcome for 60/40 portfolios is high and rising inflation, which is when both bonds and equities suffer, even outside recessions.” An increase in policy rates triggered by price pressures “remains a key risk for multi-asset portfolios. Duration risk in bond markets is much higher this cycle,” they wrote.

Bubble? Hell, no.
• The Last Time This Happened Was Just Months Before The Great Depression (ZH)
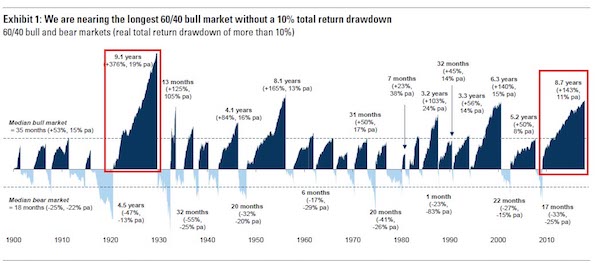
As Goldman observes: “we are closing in on the longest 60/40 bull market in history – there has been no 10% drawdown in real terms since 2009. A passive long-only balanced portfolio has delivered attractive risk-adjusted returns since the 90s. A favourable ‘Goldilocks’ macro backdrop, supported by the ‘Great Moderation’ and the central bank put, has boosted returns in both equities and bonds. However, after the recent ‘bull market in everything’, valuations across assets are as expensive as they have been this century, which reduces the potential for returns and diversification in balanced portfolios. Some more statistics: “We are nearing the longest bull market for balanced equity/bond portfolios in over a century – a simple 60/40 portfolio (60% S&P 500, 40% US 10-year bonds) has not had a drawdown of more than 10% since the GFC trough (8.7 years) and has delivered a 143% return (11% p.a.) since then.”
And when was the last time a balance portfolio had such a tremendous return? Goldman answers again: “The longest run has been during the Roaring 20s, ending with the Great Depression. The second longest run was the post-war ‘Golden age’ in the 50s – the 90s Boom has been in third place but is now fourth, after the current run. In other words, one would have to go back to some time in early 1929 to be looking at the kind of returns that a balanced “60/40” portfolio is generating today. In fact, the current period of staggering returns without a 10% total drawdown is now 8.7 years. How long was the comparable period in the 1928s? 9.1 years. Which means that if history is any guide, the second great depression is just around the corner.

If we can agree that trickle down is just a ruse invented to trick the gullible, we should also agree that any and all QE is robbery in plain daylight.
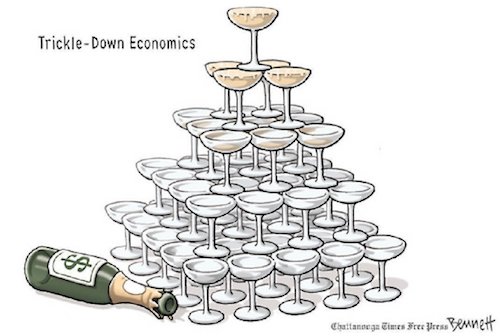
Step One in the Pecking Order Lie is to promote a narrative of trickle-down economics — that making the rich even richer is a good thing for the non-rich. This is exactly what Ben Bernanke is saying here, that the Fed’s extraordinary efforts to prop up the stock market aren’t just good for the rich, but will be good for everyone once the “wealth effect” kicks in and the rich start spending their money. Whenever someone uses the phrase “wealth effect”, they are promoting a trickle-down narrative. How does trickle-down monetary policy work? By spending TRILLIONS of dollars to buy financial assets, the world’s central banks have inflated the prices of ALL financial assets, EVERYWHERE in the world. This is not a secret plan. This is not a hidden agenda. This is the avowed purpose of what central bankers call Large Scale Asset Purchases (LSAPs).
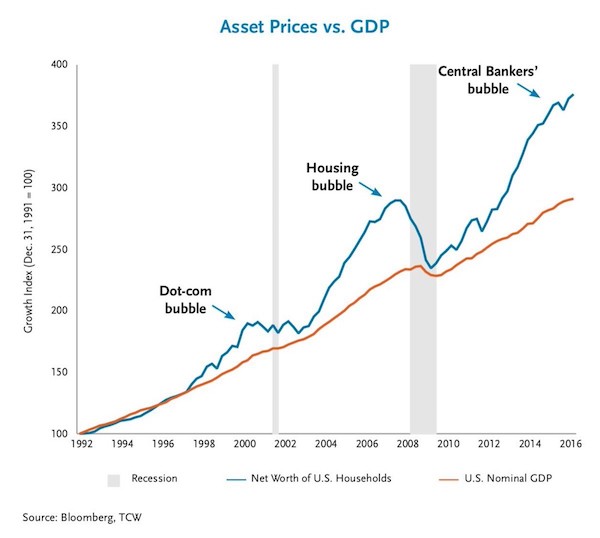
The goal is to force us to “reach for yield”. The goal is to force us to buy more and more risky assets (stocks) at higher and higher prices. The Fed is trying to make the stock market go up. And they’re succeeding. Here’s a great chart from TCW showing how this works. The orange line is the growth rate of the US economy. The blue line is the growth rate of how rich we are. By tripling the stock market, the Fed has made us much richer than our economy has grown … SOOO much richer than our economy has grown. But the goodies of a trebled stock market aren’t evenly distributed. Who owns stocks? If we’re talking about households, leaving aside pension funds and endowments and other institutional investors, it’s the rich, mostly. And that household share of the Central Bankers’ Bubble doesn’t increase linearly with wealth, but exponentially, meaning that the really rich own a lot more stocks than the merely rich, so the really rich have gotten a lot richer than the merely rich.
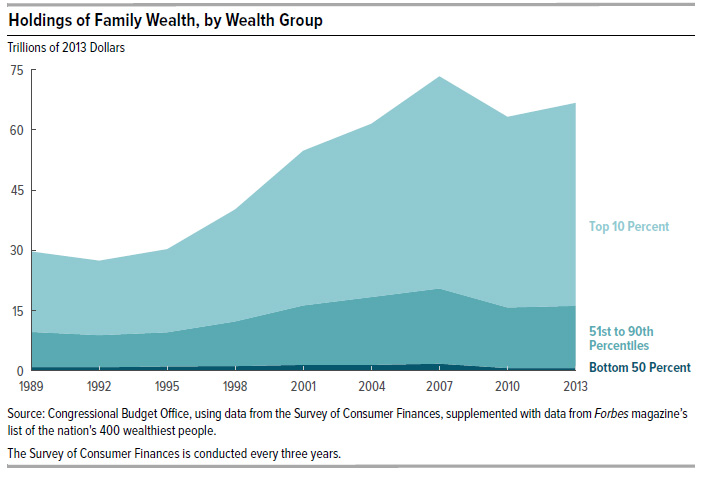
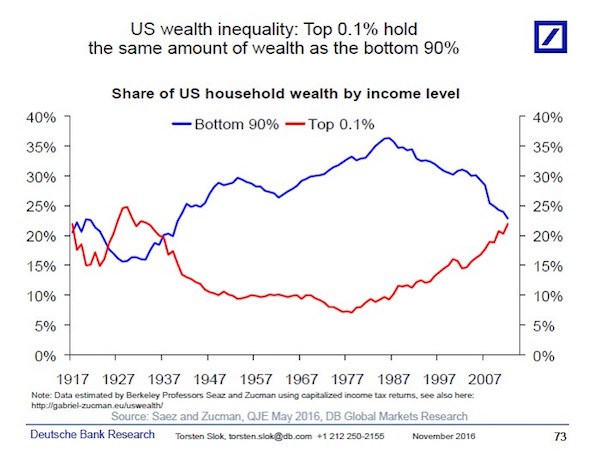
Here’s a chart from Deutsche Bank showing the impact (it’s a year old, so the effect is even more pronounced today with the stock market 20% higher). Thirty years ago, the non-rich (the bottom 90% of American households by income) owned 35% of American household wealth. Today they own about 22%. Forty years ago, the really rich (the top 1/10th of 1% of American households by income) owned about 7% of American household wealth. Today they, too, own about 22%. Moreover, the gains of the really rich have mirrored the losses of the non-rich, which means that the well-off and merely rich (the remaining 9.9% of American households) haven’t seen much of a change one way or another.
Now this shift in relative wealth of the non-rich and the really rich didn’t start with the Central Bankers’ Bubble and its narrative of trickle-down wealth effects from monetary policy. It started roughly in 1980 with the Reagan narrative of trickle-down wealth effects from fiscal policy. And before we make overly facile comparisons with the 1920s and 1930s, this chart isn’t taking into account pensions and social security and other safety net features of the modern semi-sorta-welfare state. So I don’t know how historically abnormal today’s level of significant wealth inequality might be, whether it’s Louis XVI level inequality or simply robber baron level inequality. But I know that it IS.

Love Max (as does Steve), but he doesn’t look good here. You don’t enter a discussion with Steve Keen without even trying to listen. And I remember Max pushing silver the same way he does bitcoin.
• The Bitcoin Debate: Max Keiser vs. Steve Keen (RT)

Netherlands as a (quasi-) legal money launderer.
• Why We Can’t Trust Basic Economic Figures (Qz)
Donald Trump doesn’t know what he’s talking about when he decries America’s trade deficits with countries around the world—and that’s not his fault. None of us do. Thanks to offshoring practices like those revealed in the Paradise and Panama Papers, global investment figures are “a big black hole,” says Daniel Haberly, an economic geographer at the University of Sussex. “We don’t really know what the world economy actually looks like. That’s the big burning question for me. We have this picture of what it looks like on paper but in reality it’s probably something completely different.” Look no further than the UK for an example of how crazy investment statistics are. The first name on its list of top foreign direct investors doesn’t surprise—it’s the world’s biggest economy, the United States.
Second place, however, isn’t such a behemoth. According to British government stats, the Netherlands supposedly shoveled £139.8 billion ($186 billion), 28% of its GDP, into the UK in 2015. Anglo-Dutch ties run long and deep, but can a country of just 17 million people really be investing so much cash into Britain alone? Quite simply, no. The Netherlands is not just a smallish European trading nation—it’s also one of the world’s biggest conduits for cash going to and from tax havens. When the British government broke down its FDI statistics this year (chapter 6), it realized that only 34.5% of that money actually came from the Netherlands; much of the rest being from European subsidiaries of big US companies or… from British companies rerouting their money.


The US political system failing to tackle healthcare, with a ton of examples how to do it across the world, tells you all you need to know about how morally bankrupt it is.
• What Americans Spent The Most Money On In The Third Quarter (ZH)
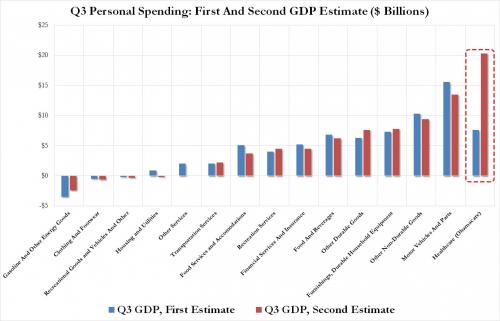
One month ago, when the BEA released its first estimate of the hurricane-impacted economy during the third quarter (which came in at a stronger than expected 3.0%) we were surprised to report that according to the Department of Commerce, in the third quarter the biggest driver of marginal spending was car sales (technically Motor Vehicles and Parts), which increased by $15.6 billion to $463.5 billion. Which, as we said at the time and considering recent US and global automakers data, was paradoxical in light of the ongoing decline in overall sales in the second half of 2017, and it was far too early to expect the post-hurricane spending spree. It was also surprising because as Americans splurged on cars, they pulled back on gasoline purchases, which was the single biggest detractor to spending, subtracting a marginal $3.5 billion in PCE, to $283.6 billion.
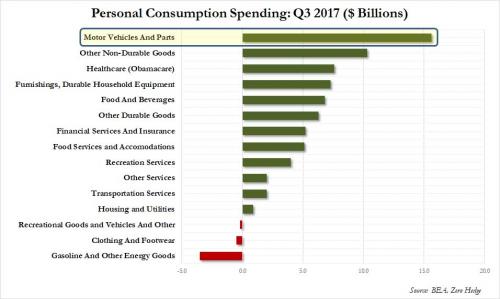
In any case, we concluded by saying that “we now await for the revisions to this initial estimate over the coming two months, because something tells us that the auto spending spree will be thoroughly revised well lower.” One month later, when the BEA released its second Q3 GDP estimate, it appears we were right: the contribution from motor vehicles was indeed revised lower, but not nearly as dramatically as we expected, only from a marginal increase of $15.6 million to $13.5 million. And yet, many other line items did see a downward revision, which means that something had to increase sharply to compensate for the downward revisions among other spending components.
Sure enough, something did: the old faithful “plug” which has saved the US economy every quarter for the past 4 years: Healthcare, or as it is better known, Obamacare, because with Trump failing to repeal Obama’s signature health law, it means that Healthcare will merrily “contribute to GDP” for years to come, by being the single biggest marginal spending item for the foreseeable future.
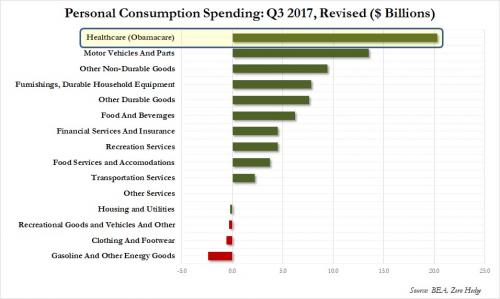
Finally, for a comparison of how dramatically the contribution of “Healthcare” was revised higher, here is a chart showing side by side the change in spending among all key line items. One can almost hear the orders “from above” to make GDP 3% or higher at any cost when looking at this chart.

Must. Read. Like anything Hudson.
• Monetary Imperialism (Michael Hudson)
In theory, the global financial system is supposed to help every country gain. Mainstream teaching of international finance, trade and “foreign aid” (defined simply as any government credit) depicts an almost utopian system uplifting all countries, not stripping their assets and imposing austerity. The reality since World War I is that the United States has taken the lead in shaping the international financial system to promote gains for its own bankers, farm exporters, its oil and gas sector, and buyers of foreign resources – and most of all, to collect on debts owed to it. Each time this global system has broken down over the past century, the major destabilizing force has been American over-reach and the drive by its bankers and bondholders for short-term gains.
The dollar-centered financial system is leaving more industrial as well as Third World countries debt-strapped. Its three institutional pillars – the IMF, World Bank and World Trade Organization – have imposed monetary, fiscal and financial dependency, most recently by the post-Soviet Baltics, Greece and the rest of southern Europe. The resulting strains are now reaching the point where they are breaking apart the arrangements put in place after World War II. The most destructive fiction of international finance is that all debts can be paid, and indeed should be paid, even when this tears economies apart by forcing them into austerity – to save bondholders, not labor and industry. Yet European countries, and especially Germany, have shied from pressing for a more balanced global economy that would foster growth for all countries and avoid the current economic slowdown and debt deflation.
After World War I the U.S. Government deviated from what had been traditional European policy – forgiving military support costs among the victors. U.S. officials demanded payment for the arms shipped to its Allies in the years before America entered the Great War in 1917. The Allies turned to Germany for reparations to pay these debts. Headed by John Maynard Keynes, British diplomats sought to clean their hands of responsibility for the consequences by promising that all the money they received from Germany would simply be forwarded to the U.S. Treasury. The sums were so unpayably high that Germany was driven into austerity and collapse. The nation suffered hyperinflation as the Reichsbank printed marks to throw onto the foreign exchange also were pushed into financial collapse. The debt deflation was much like that of Third World debtors a generation ago, and today’s southern European PIIGS (Portugal, Ireland, Italy, Greece and Spain).

Medieval third world.
• One In 10 London Families Rely On Food Banks To Survive (Ind.)
One in 10 London families are relying on charity handouts to eat and food banks are facing unprecedented strain in the run-up to Christmas, new figures reveal. One in four London parents worry about being able to afford to feed their children, the research found, while almost one in five have to choose between heating their homes or feeding their family. The exclusive poll, conducted by Kellogg’s to mark the start of The Independent and Evening Standard Help a Hungry Child campaign, exposed the devastating choices facing parents around the country as food banks struggle to keep up with growing demand. At least 146,798 three-day emergency parcels were handed out by Trussell Trust foodbanks in December 2016, a 47% spike compared to the average for the overall 2016/17 financial year, according to the charity.
Children accounted for 61,093 of those affected. Now the charity is warning 2017 could herald an even higher increase, following a 13% surge in food bank usage during the first six months of this year. The figures are revealed as a Labour MP urges the Government to accurately measure the number of people going hungry with a food insecurity bill. Emma Lewell-Buck, a member of the All-Party Parliamentary Group on Hunger, will present the cost-neutral bill to the Commons on Wednesday. It will ask the Government to incorporate questions about how often people go without food into national surveys. She called rising food bank usage a “massive dereliction of state duty” and is urging Theresa May to take urgent action to recognise the scale of the problem.
“They have to admit what everybody already knows that the levels of hunger are far higher than we have realised,” she said. “It is the duty of the state, there is no way food banks should have filled the gap left by the welfare state that this Government has created.” She added: “Now food banks are becoming a pillar of the welfare state and they should not be and they should never have been.” The South Shields MP said getting a measure on the true scale of the numbers going hungry would force the Government into taking a more proactive stance in tackling hunger.

Talk about a failed society…
• Half A Million UK Children Go To School Hungry Every Day (Ind.)
When money is tight eight-year-old Emma’s parents are forced to send their daughter to school, tummy rumbling, without any breakfast. In the evening, she fills up on plain pasta or reduced microwave meals – cheap food her parents can afford. Emma says she often feels too tired to concentrate on her schoolwork. The situation Emma lives with is the devastating reality faced by the 500,000 children across the UK who go to school hungry each day. Eight million people in Britain – the world’s sixth largest economy – are living in food poverty, according to the United Nations (UN). And an estimated 870,000 children in England may be going to bed hungry each night because their parents are unable to provide the meals they need.
But not eating isn’t the only problem – access to nourishing and nutrient-filled food is simply out of reach for thousands of families living on the breadline, with far-reaching consequences for too many of Britain’s children. Dr George Grimble, a medical scientist at University College London, said the situation was “disastrous” for developing children, resulting in malnourishment, obesity and squandered potential. “When people are in poverty they are forced to buy the cheapest foods – filling but nutrient-lacking food,” Dr Grimble told The Independent. “Food poverty in the community overlays to a large extent on disease malnutrition.” More than 60% of paediatricians believe food insecurity contributed to the ill health among children they treat, according to a 2017 survey by the Royal College of Paediatricians and Child Health.
The harrowing hunger stats sit juxtaposed with the fact 100 million tons of food is wasted each year across the EU. More than 400 million meals’ worth of edible food was sent to landfill in 2016 which could have been redistributed to feed hungry people across Britain, according to the Government’s waste advisory body, Wrap.

“..succumbed to populists..” is too easy a cop-out. These countries will define Europe going forward.
• All Is Not Well In The Visegrad Economies (CER)
On the face of it, the Visegrad countries – the Czech Republic, Hungary, Poland and Slovakia – are doing well economically. The data for GDP per head suggest a gradual convergence in living standards with Western Europe. They continue to attract a disproportionate share of inward investment in EU manufacturing, and their integration into EU-wide supply chains helps to explain why they are now collectively Germany’s most important trade partner, ahead of China and the US. But the political situation across the Visegrad is anything but rosy. Voters in all four countries have succumbed to populists. The reasons for this populism are complex, but economics probably provides a bigger part of the explanation than the positive headline numbers suggest.
In 2016, GDP per head in the Visegrad four (adjusted for price differences) ranged from 64% of eurozone levels in Poland to 82% in the Czech Republic. The Czech Republic, Slovakia and Poland have experienced significant convergence in GDP per head with the eurozone over the last ten years (though it should be noted that the dire performance of the eurozone economy over that period was a major reason for this). But what matters to the average person is not GDP growth, but personal income growth, and hence living standards. And here the Visegrad picture is less reassuring. In 2016 worker ‘compensation’ (wages and salaries and other benefits) ranged from just 50% of the eurozone’s in Hungary to 59% in the Czech Republic. And the rate of convergence of compensation with the eurozone average has been slower than the rate of convergence of GDP.
Growth in consumption across the Visegrad countries has lagged behind growth in GDP, resulting in a sharp fall in consumption as a share of overall spending. This has happened in nearly all developed economies over the last decade, but the scale of the decline in all four Visegrad economies has been much greater. Average households have not seen enough of the fruits of economic growth. Those rewards have gone disproportionately to the owners of capital, and in these countries, that tends to mean foreigners. In the Czech Republic, Hungary, and Slovakia, the most important sectors are largely or wholly foreign-owned. The Polish economy is much bigger and more diversified than the other three, but the level of foreign ownership is still very high.

How about the pressure on US, France, UK?
• Pressure On Greece To Scrap Arms Deal With Saudi Arabia (G.)
The Greek government has announced it will abide by any EU embargo on Saudi Arabia as it faces criticism over a controversial arms deal, including from its own MPs. As cracks appeared in the leftist-led coalition over the €66m weapons agreement with the kingdom, the administration’s spokesman said Athens would apply the law “by the letter” if EU sanctions were announced. “We are waiting to see the decisions of the European parliament and will act accordingly,” said Dimitris Tzannakopoulos. “The process is frozen.” Mounting tensions within the ruling Syriza party have matched international condemnation of the agreement by human rights groups. Amnesty International has said the munitions could end up being used by the Gulf state in its war against neighbouring Yemen, where civilian populations have borne the brunt of the conflict.
“[We] call on Greece to immediately rescind the sale and transfer of military equipment to Saudi Arabia and to refuse approval of the transport of every type of conventional weapons, ammunitions and war material to point of conflicts in Yemen,” the rights group said. Prominent members of the ruling Syriza party have questioned the morality of selling arms to Saudi Arabia, and on Tuesday the Greek parliament’s military procurements committee also hinted it may scrap the deal. “Greece is a hub of stability, peace and friendship in the greater region and that is what it should be exporting,” the former deputy European affairs minister Nikos Xydakis told the Guardian. “There is no need for this [deal] to go through and frankly when we’re talking about €66m, not €66bn, it isn’t worth the trouble. It’s not the sort of money that will save Greece.”

Whose initiative? Brussels, Berlin?
• Greece Moves Hundreds Of Asylum Seekers From Lesvos To Mainland (R.)
Greek authorities on Thursday said they have moved a few hundred asylum seekers from the island of Lesvos to the mainland in an effort to ease overcrowding in its camps. Thousands of asylum seekers have become stranded on Lesbos and four other islands close to Turkey since the European Union agreed a deal with Ankara in March 2016 to shut down the route through Greece. “I came to heaven from hell,” said 30-year old Mohammad Firuz, who lived for two months in a state-run camp in Lesvos.
Firuz was among 300 people, many of them women and children, aboard a ferry that reached the port of Piraeus early on Thursday morning. The asylum seekers would be taken to camps and apartments in the mainland, authorities said. Lesvos is now hosting some 8,500 asylum-seekers, nearly three times the capacity of state-run facilities. Violence often breaks out, mainly over delays in asylum procedures and poor living standards. Lesvos residents went on strike earlier this month to protest against European policies they say have turned it into a “prison” for migrants and refugees.

This is just too nuts. Ban the shit.
• Common Pesticide Can Make Migrating Birds Lose Their Way (G.)
The world’s most widely used insecticide may cause migrating songbirds to lose their sense of direction and suffer drastic weight loss, according to new research. The work is significant because it is the first direct evidence that neonicotinoids can harm songbirds and their migration, and it adds to small but growing research suggesting the pesticides may damage wildlife far beyond bees and other insects. Farmland birds have declined drastically in North America and Europe in recent decades and pesticides have long been suspected as playing a role. The first evidence for a link came in 2014 when a study in the Netherlands found that bird populations fell most sharply in the areas where neonicotinoid pollution was highest, with starlings, tree sparrows and swallows among the most affected.
“The reason our new study is special is this is not a correlation – it is actual experimental evidence,” said Prof Christy Morrissey, at the University of Saskatchewan in Canada, who said the results shocked her. “The effects were really dramatic. We didn’t anticipate the acute toxicity, because the levels [of neonicotinoid] we gave them were so low. Three neonicotinoids were banned from use on flowering crops in the European Union in 2013 due to unacceptable risks to bees and other pollinators and a total outdoor ban is being considered. Canada is also considering a total ban. Neonicotinoids now pollute the environment across the world and pressure is growing to slash pesticide use, which research shows would not reduce food production on almost all farms.
The new research, published in the peer-reviewed journal Scientific Reports, analysed the effect of the neonicotinoid imidacloprid on white-crowned sparrows that migrate from the southern US and Mexico to northern Canada in summer. Birds were given doses equivalent to less than a single corn seed and within hours became weak, developed stomach problems and stopped eating. They quickly lost 17-25% of their weight, depending on the dose, and were unable to identify the northward direction of their migration. “Basically, these birds became lost,” said Morrissey. Control birds that were not exposed to the insecticide were unaffected.

Again: ban the shit.
• ‘Shocking’ Rise In Rubbish Washing Up On UK Beaches (G.)
The rubbish washing up on the UK’s beaches is continuing to increase, rising by 10% in 2017, the Marine Conservation Society’s (MCS) annual beach clean has revealed. Much of the waste is plastic, leading the MCS to call on the government to urgently introduce a charge on single-use plastic items, such as straws, cups and cutlery. The chancellor, Philip Hammond, recently announced the government is considering such action. About 12m tonnes of plastic litter enters the oceans every year, killing millions of marine animals. People are also believed to be inadvertently eating the plastic, potentially contaminated with toxic chemicals, via seafood. The MCS beach clean in September saw 7,000 volunteers scour 340 beaches and collect an average of 718 pieces of rubbish every 100 metres.
The survey uses a standard methodology and data from the last decade and shows a rising tide of litter along the coast. Most of the litter is small, unidentifiable fragments of plastic, broken down in the sea from larger objects and often mistaken for food by fish and birds. But 20% of the rubbish is packaging from “on the go” food and drink, such as cups, bottles, cutlery, stirrers and sandwich packets. “Our beach clean evidence shows a shocking rise in the amount of litter this year,” said Sandy Luk, MCS chief executive. “Our oceans are choking in plastic. We urgently need a levy on single-use plastic as a first step.” “We are concerned we are continuing on this upwards trend,” said Lizzie Prior, beach and river clean project officer at the MCS. “Plastic never goes away – it does not decompose. It just goes to smaller and smaller pieces and becomes much more harmful for our marine environment.”
She said the tax on plastic bags introduced in 2015, which has seen their use drop by 85%, had a rapid impact, with the number of bags found on beaches down by 40% since 2014. “It is really fantastic to see that small charge completely changed people’s behaviour,” she said. “A levy [on other single use plastic] would be a fantastic next step.”

Any day now, McDonald’s will start beaming ads onto the surface of the moon.
• Lobster Found With Pepsi Logo ‘Tattoo’ (G.)
Concerns over debris littering the world’s oceans are back in the spotlight after a Canadian fishing crew found a lobster with the blue and red Pepsi logo imprinted on its claw. Trapped in the waters off Grand Manan, New Brunswick, the lobster had been loaded onto a crate to have its claws banded when Karissa Lindstrand came across it. Lindstrand, who drinks as many as 12 cans of Pepsi a day, quickly spotted the resemblance. “I was like: ‘Oh, that’s a Pepsi can,’” she said. On closer look, it seemed more like a tattoo on the claw. “It looked like it was a print put right on the lobster claw.” Neither she or any of the crew had seen anything like it. More than a week after the find, debate has swirled over how it might have come to be: some believe the lobster might have grown around a can that ended up at the bottom of the ocean.
Others speculate that part of a Pepsi box somehow become stuck on the lobster. Lindstrand disputes these theories. The image on the claw was pixelated, she said, suggesting it couldn’t have come from a can. And the image on a Pepsi box is far too large to be what she saw on the claw. The logo looked like it came from a printed picture, but paper would have deteriorated in the ocean. “I’m still trying to wrap my brain around what exactly it was,” she said. The find comes amid growing concerns over the amount of debris accumulating in the world’s oceans. Between 5m and 13m tonnes of plastic leak into the world’s oceans each year to be ingested by sea birds, fish and other organisms, leading the record-breaking sailor Dame Ellen MacArthur to warn that by 2050 the sea could have more plastic in it than fish, by weight.


