Dorothea Lange Oklahoma drought refugee family near Lordsburg, New Mexico May 1937
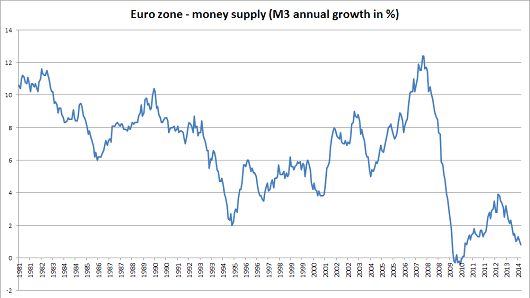
I had seen the reports on Italy and Britain preparing to add heroin and hookers to their GDP, but I had put that down to some kind of desperate quirkiness. Now, though, I heard today that this is actually due to an EU directive, and the number crunchers at Eurostat demand countries obey this newfound accounting magic trick.
Even saw someone claim that the reason behind it is that since drugs and prostitution are deemed legal in the Netherlands, both are already part of GDP there, and that to make the numbers compatible, other countries should add them as well. Because, obviously, it’s much easier to add to GDP numbers that are nothing but guesswork in the first place (apparently, police files are used), in 27 different countries, than to subtract them in one …
Governments will do anything to make GDP numbers look better, and it’s a miracle – or a testament to their intelligence – that none of them tried this one ages ago, in one form or another. And the moral highground knights who say one should not add the disease that is addiction, to positive GDP numbers, if only because it is damaging and grossly expensive to society, may well be right in that claim, but they forget that those negative and expensive consequences all boost GDP numbers just as much.
Medical treatment, insurance claims paid out for breaking and entering, the decay of entire neighborhoods, you name it, they count it as positive. Want to help the economy? Drive your car into a wall; or better yet, a schoolbus. Any real patriot should be on crack. Uncle Sam wants you! The essence is, in case this has still not trickled through, that destruction makes up a core – and huge – part of GDP.
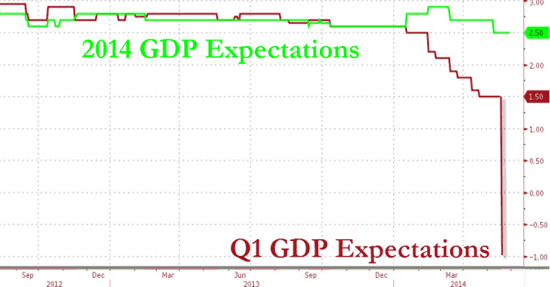
What Europe can do, America can do better, of course, though adding prostitution to GDP in the bible belt or in Utah may not be all that easy to do. But who needs it? Q1 GDP, as you probably know, was revised downwards to -2.96%, and that was a classic case of the thrown towel. Once it was obvious it would be negative, as was made clear in last month’s second revision to -1.0% , it didn’t matter much anymore how negative it would get. And that awakens the bit of creativity that exists among the data driven government crowd.
Whereas Obamacare numbers were initially used to make Q1 look less bad, they were now simply taken out, so Q1 got really ugly, but because of that Q2 can truly shine. Or so they think. I said yesterday that Q2 will be announced next month as +2-2.5%, but Tyler Durden may well be right, and it may be even higher, though I doubt they’ll go for Durden’s 5% estimate, or even Goldman’s 4%. Look, they don’t need to, the difference between -2.96% and + 3% is already big enough to create some stunning headlines with.
Still, the government is stretching it now in their faith of what they can make people believe. This graph Durden posted just baffles the mind. We understand what goes on, even if there’s no explanation forthcoming, and we understand that Obamacare was launched on January 1, and all sorts of things changed, but if you look at the differences here, and you realize that what you see is the discrepancy between this month’s final revision and last month’s second one, which came almost 2 full months after Q1 closed, you’d be inclined to ban the Department of Commerce ‘figure’ heads from ever coming near a calculator again.
Another thing Durden rightly points to is the marginal utility of debt, or the amount of GDP growth generated by an increase in debt. For Q1, US federal debt rose by $250 billion, while GDO dropped by $74 billion. in other words, debt doesn’t just not buy growth any longer, it actually diminishes it. This is not a new stat, and even China’s marginal utility of debt has been inching close to zero for a while now, and I’m sure there’ll be all sorts of explanations offered that why this was a one-off etc., but glancing over the revised numbers from the past 4 years, you can’t help thinking that this is what is meant but the Fed “pushing on a string”.
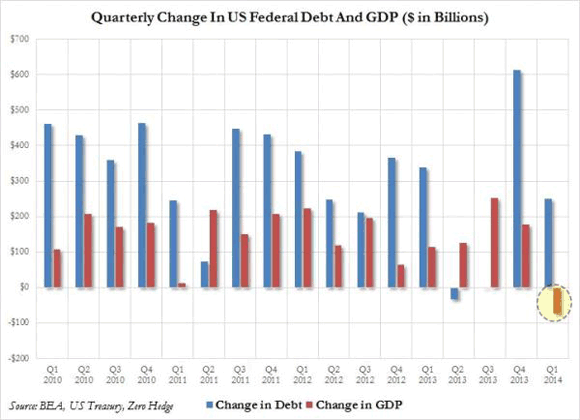
Q4 2013 is generally seen as quite good, but that’s just because federal; debt rose most in those 4 years, and still GDP rose by less than a third of the additional debt. Again, plenty explanations will be offered by pundits and bankers and statisticians, but if you simply add up all the differences between the added debt per quarter and the GDP growth it engendered, you must conclude you’re watching a losing game. And I know the guys in the Keynes jerseys will keep claiming it will get better, but they’ve been getting their asses kicked by the numbers since 2008 now, and, I have no doubt, longer than that. Despite the fact that, to stay in a soccer metaphor, they have the referees – the government number bureaus – in their corner. But then take one good look at this:
One last number from yesterday that I don’t think has gotten anywhere near enough attention is US exports, which were down a stunningly whopping 8.9%. That screams: how ugly would you like it? Like healthcare stats, something may have been moves forward to Q2 for that as well, but really, how bad was that winter? Were the ports all frozen solid that nothing could be shipped out? What happened there? And, perhaps more importantly, what will that number be for Q2? Will the figureheads be bold enough to come up with a, say, +5% export print, a 13.9% difference? And what will the explanation offered for that difference be?
We’ve entered Sillyland when it comes to GDP numbers, and governments are pretty desperately trying to figure how far they can go when it comes to making themselves and their stats look better than either really are. For now, they can rely on downward revisions of initially trumped up numbers, revisions that lag daily events by so much nobody cares anymore when they’re released. Even if longer term stats look absolutely awful, the focus will always be on tomorrow, not yesterday. Once you know how the human mind works, you use that knowledge to your advantage, right?
I’ll leave y’all with a question then: how do you think the US economy will overcome an 8.9% plunge in exports? Or a -2.96% GDP drop? What will go through your head when in a few weeks time the media will be filled with rosy and sunny and glorious data on how well “we” are doing?
Will today’s awful numbers still be right there in the front of your mind for comparison, or will they have faded? Q1 is almost 3 months ago, it’s so far in the past our propensity to filter out negative information has already done its job. That’s what your government counts on. Is your tolerance for deceit in numbers exhausted yet, or will you be easy prey once again?


Hey! We’re making history! Rejoice!
• US Economy’s Stumble In First Quarter Historic (MarketWatch)
The U.S. economy contracted by 2.9% in the first quarter, marking the biggest drop since early 2009 when the Great Recession was winding down, according to newly revised government figures. The chief reason: Americans spent less than originally assumed, mainly on health care. A bigger drop in U.S. exports, higher imports and a smaller buildup in inventories also contributed to the steeper decline in gross domestic product. The economy previously was estimated to have shrunk 1% in the first three months of the year, a period marked by unusually harsh winter weather that clogged roads, closed workplaces and kept many employees and shoppers home. How bad was the first quarter? The decline was the biggest during a prolonged expansionary phase in the economy since the end of World War II.
The revised GDP report briefly stunned Wall Street and clearly unsettled the White House. President Obama’s chief economic adviser, Jason Furman, cast doubt on the report and argued the economy is much stronger than the first-quarter contraction implied. Investors, for their part, shrugged off the backward-looking report. The economy appears to have rebounded in the second quarter and economists polled by MarketWatch predict growth will turn positive again, with a 3.8% increase. The deep drop in GDP from January to March largely stems from lower consumer outlays. The government marked down the increase in consumer spending—the main engine of U.S. economic activity—to a meager 1% in the first quarter from 3.1%.
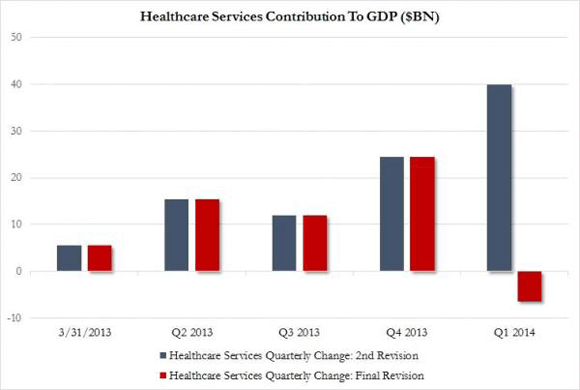
For the most part, the reduced spending reflected lower medical costs. The Bureau of Economic Analysis originally assumed that the introduction of Obamacare would boost health-care spending in the first three months of the year. Yet health-related spending actually fell by $6.4 billion instead of rising by $39.9 billion as previously estimated, according to the revised data . As a result, consumer spending on services rose just 1.5% and not a heady 4.3%. And spending on everyday goods such as groceries or personal-care items fell slightly instead of increasing. The decline in U.S. exports, meanwhile, was even sharper at 8.9% and imports rose 1.8%, which was more than twice as high as previously reported. A bigger trade deficit is a drag on U.S. growth.
What’s more, the increase in business inventories was marked down to $45.9 billion from $51.6 billion. The production of goods for later sale is a plus for GDP, but restocking of warehouse shelves took place at less than half the rate in early 2014 compared with the third and fourth quarters of last year. Final sales of U.S. produced goods and services, meanwhile, was reduced to show a 1.3% decline instead of a 0.6% increase.
• In Q1, +$250 Billion In Federal Debt Bought -$74 Billion In GDP (Zero Hedge)
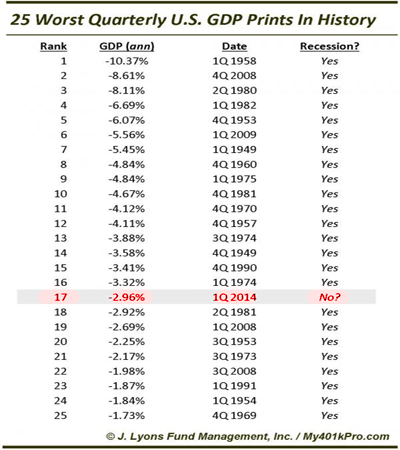
As everyone knows by now, in Q1 the US economy “grew” (we use the term loosely because the correct term is shrank) by the lowest amount in Q1 since 2009. More to the point, the -2.9% collapse in GDP was the 17th worst quarterly print in US history.
That much is largely known by now. What may not be known is that while there has been at least one quarter in the past 5 years in which the US economy shrank on a CAGR basis (at least until a new and improved definition of GDP revises that away) since 2009 there has never been a quarter in which the economy shrank sequentially in nominal terms. Which is what it did in Q1, when it declined by $74 billion. Which brings us to the topic of marginal utility of debt, extensively covered here in the past. In brief, it describes how much in “economic growth” every dollar in federal debt buys. The bad news: in Q1, US total Federal debt rose by $250 billion, to a record (duh) $17.6 trillion. This debt “bought” a negative $74 billion in GDP, which declined to $17.0 trillion. Said otherwise, this was the first quarter since the end of the recession when debt rose (by a whopping amount), and when GDP declined sequentially in nominal terms.
And they’re not kidding.
• Goldman Boosts Q2 GDP Forecast Due To Collapse In Q1 GDP (Zero Hedge)
“…we think that Q1 GDP was an aberration, and is not representative of the strengthening underlying trend in US growth.” There is nothing we can add to such brilliant weatherman insight as what Jan Hatzius from Goldman just unleashed on the unwitting muppets (all of whom can’t wait for Goldman’s second above-consensus GDP forecast to pan out… unlike the last time in 2010). In brief: Goldman just boosted their Q2 tracking GDP from 3.8% to 4.0% because Q1 GDP imploded. And scene.
Bottom Line: Q1 GDP was revised down even more than expected, mainly due to lower-than-expected healthcare spending. The May durable goods report was a bit weaker than expected, although inventories rose more than expected. We increased our Q2 GDP tracking estimate by two-tenths to 4.0%.
1. Q1 GDP was revised to -2.9% in the third estimate (vs. consensus -1.8%), from -1.0% previously. The downward revision was concentrated in two categories: healthcare spending subtracted 1.2 percentage points (pp) relative to the second estimate, while net exports subtracted 0.6 pp. All other components of GDP combined contributed a further one-tenth to the revision. We had anticipated downward revisions to both healthcare spending and net exports—in particular in light of the weak healthcare numbers in the Q1 Quarterly Services Survey – but the extent of these revisions was larger than we expected.
2. Headline durable goods orders fell 1.0% in May (vs. consensus flat). Within the typically volatile categories, a large decline in defense orders (-31.4%) and a modest decline in non-defense aircraft (-4.0%) pulled down the headline figure. Core capital goods orders rose 0.7% (vs. consensus +0.5%) and core capital goods shipments—used by the Commerce Department to calculate the equipment investment component of the GDP report—rose 0.4% (vs. consensus +1.0%) in May. Growth in durable manufacturing inventories grew 1.0% in May and was revised up two-tenths to 0.3% in April.
3. We increased our Q2 GDP tracking estimate by two-tenths to 4.0%.
Baghdad Bob is spinning in his grave.
Look at the revision in that chart. It’s insanely beyond all comprehension.
• The Reason For The Total Collapse In Q1 GDP Is … To Boost Q2 (Zero Hedge)
Remember back in April, when the first GDP estimate was released (a gargantuan by comparison 0.1% hence revised to a depression equivalent -2.9%), we wrote: “If It Wasn’t For Obamacare, Q1 GDP Would Be Negative.” Well, now that GDP is not only negative, but the worst it has been in five years, we are once again proven right. But not only because GDP was indeed negative, but because the real reason for today’s epic collapse in GDP was, you guessed it, Obamacare. Turns out this number was based on … nothing. Because as the next chart below shows, between the second and final revision of Q1 GDP something dramatic happened: instead of contributing $40 billion to real GDP in Q1, Obamacare magically ended up subtracting $6.4 billion from GDP. This, in turn, resulted in a collapse in Personal Consumption Expenditures as a percentage of GDP to just 0.7%, the lowest since 2009!
Don’t worry though: this is actually great news! Because the brilliant propaganda minds at the Dept of Commerce figured out something banks also realized with the stub “kitchen sink” quarter in November 2008. Namely, since Q1 is a total loss in GDP terms, let’s just remove Obamacare spending as a contributor to Q1 GDP and just shove it in Q2. Stated otherwise, some $40 billion in PCE that was supposed to boost Q1 GDP will now be added to Q2-Q4. And now, we all await as the US department of truth says, with a straight face, that in Q2 the US GDP “grew” by over 5% (no really: you’ll see).
Mob rules.
• Dark Pool Greed Drove Barclays to Lie to Clients (Bloomberg)
Barclays was so bent on lifting its private trading venue to the upper ranks of Wall Street dark pools that it lied to customers and masked the role of high-frequency traders, according to New York’s attorney general. Barclays falsified marketing materials to hide how much high-frequency traders were buying and selling, according to a complaint filed today by Eric Schneiderman. Barclays runs one of Wall Street’s largest dark pools, a private trading venue where investors can trade stocks mostly anonymously. Schneiderman has taken a leading role in seeking to reform how equities trade in the $23 trillion U.S. stock market, examining whether exchanges and dark pools give unfair perks to high-frequency traders. His suit against Barclays says clients such as institutional investors were the losers, led to believe they were safe from predators on a trading venue where aggressive trading strategies were in fact encouraged.
“This is obviously a breach of confidence, a breach of trust,” said Joe Saluzzi, co-head of equity trading at Themis Trading in Chatham, New Jersey. “It’s pretty obvious at this point that the SEC needs to come in, it needs to know what’s going on actually inside these boxes. Barclays – are they the only ones? We don’t know. I don’t know.” In a statement, Mark Lane, a spokesman for London-based Barclays said: “We take these allegations very seriously. Barclays has been cooperating with the New York Attorney General and the SEC and has been examining this matter internally. The integrity of the markets is a top priority of Barclays.”
• How Barclays Got Caught Red-Handed With “Pernicious HFT Fraud” (Zero Hedge)
First it was gold, now it is HFT – poor Barclays just can’t get away with any market rigging crime these days. Remember when in the aftermath of the most recent Michael Lewis-inspired HFT scandal, one after another HFT and Dark Pool exchange swore up and down they know, see, hear and certainly trade no predatory algo evil? Turns out they lied, as usual. As was reported earlier, the NY AG just charged Barclays with fraud (or rather, as Schneiderman called it repeatedly “pernicious fraud”) for not only misrepresenting the nature of its dark pool to clients, but also exposing them to numerous “toxic” and predatory HFT algos – another word for algos which frontran orderflow either within the Barclays dark pool, Barclays LX – arguably the second largest venue in the US second only to Credit Suisse’ Crossfinder – or on different lit and unlit venues as soon as they had seen the flow as indicated by Barclays.
As Bloomberg explains, “Barclays Plc was so bent on lifting its private trading venue to the upper ranks of Wall Street dark pools that it lied to customers and masked the role of high-frequency traders, according to New York’s attorney general.”
Barclays falsified marketing materials to hide how much high-frequency traders were buying and selling, according to a complaint filed today by Eric Schneiderman. Barclays runs one of Wall Street’s largest dark pools, a private trading venue where investors can trade stocks mostly anonymously.
Here Bloomberg goes so far as to give “critics” like us credit for something we have said since 2009:
Schneiderman’s action will fortify a suspicion common among critics of dark pools and high-frequency firms, which have proliferated in the past decade with advances in computer power and efforts to spur competition among U.S. trading venues. Namely, that in the rush to attract traders to their markets and boost profits, the venues have catered to computerized market makers to the detriment of individuals.
Actually, replace “fortify” with “confirm.” Because what the Scheinderman action proves without doubt is that in order to generate ever-bigger trading revenue profits and to pull as much activity from lit exchanges, big banks and all other exchanges for that matter, would gladly sell order flow of traditional clients to HFTs in order to allow frontrunning of their orders. In exchange for this Barclays et al (yes, every other dark pool out there does the same) would be compensated handsomely from the same HFTs that make money without taking any risk, as all they do is simply frontrun legitimate orders.
If you don’t stop it, who will?
• Big Housing Doles Out Big Election Cash (MarketWatch)
The housing market is in better shape than it was two years ago, but major issues are still in flux, and industry participants are placing large bets on favored congressional candidates ahead of the November election. Housing groups have already spent millions of dollars this election season, and check-writing is sure to ramp up over coming months. Given the partisan gridlock in Congress, one might wonder why the industry would bother to invest so much in lawmakers who may accomplish very little. The answer is simple: advocates must use every opportunity to promote their position. “A trade group representing an industry cannot be caught on the sidelines and unprepared,” said Brian Gardner, an analyst at Keefe, Bruyette & Woods. “Groups and advocates want to be proactive and always try to build political capital, even when the prospects of legislation are low.”
The major looming political issue for the housing industry is mortgage-finance reform, including what to do with federally controlled giants Fannie Mae and Freddie Mac, which back about six-in-10 new mortgages. Much of the housing industry wants Congress to retain some place for the government in the mortgage marketplace, while encouraging greater private investment. Other priorities for the housing industry are whether tax reform will hit the mortgage-interest deduction, terrorism-risk insurance, flood insurance, immigration, and other issues.
Where the real power resides.
• House Passes Bill To Weaken Dodd-Frank, Deregulate Wall Street (HuffPo)
The U.S. House of Representatives on Tuesday passed a financial deregulation package that would benefit the Koch brothers and the nation’s largest banks by a vote of 265-143. The legislation would significantly weaken elements of the 2010 Dodd-Frank financial reform law dealing with derivatives – the complex products at the heart of the 2008 meltdown. Many components of the bill approved Tuesday had previously passed the House with bipartisan support. However, Democratic backing had been weakest on the most controversial measure, which allows U.S. firms to skirt domestic regulations on some derivatives by conducting trades through offshore affiliates in other major financial centers.
Republicans were almost uniform in their support, with Rep. Walter Jones (N.C.) the lone GOP holdout. Democratic opposition was broad, with only 46 Democrats voting in support — a marked change from several recent House votes on Wall Street deregulation that have drawn substantial backing from dozens, and in some cases an overwhelming majority, of House Democrats. The White House issued a formal statement last week saying that it “strongly opposes” the legislation that passed Tuesday. The bill includes several separate deregulatory measures sought by the largest Wall Street banks and the Koch brothers, who control significant financial and energy derivatives operations. Americans for Financial Reform, the premier policy analysis organization among bank watchdogs, advocated strongly against the bill alongside consumer groups and the AFL-CIO.
Funny.
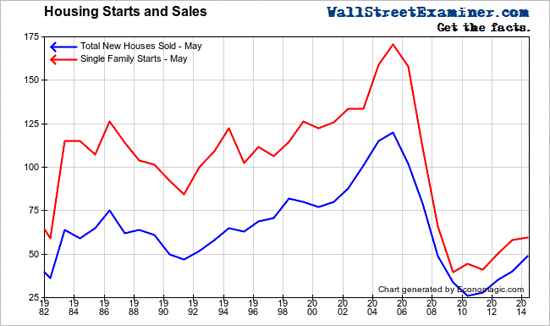
• New Home Sales Soar To Reach Housing Depression Lows (Lee Adler)
New home sales soared in May to 49,000 units, reaching the level reached at the bottom of the 1987-91 real estate depression as well as to the level of May 2008, near the bottom of the worst US economic depression since the 1930s. Mainstream conomic pundits and financial media personalities were ecstatic. After all it’s not often that a sector as important as housing is to the US economy recovers from nearly non-existent all the way back to previous depression levels. It’s even more impressive considering that there are 29 million more US households than in 1991. What a great moment for the US economy! Congratulations to the housing industry and especially to the Fed for a job well done, and to the US financial media for doing its usual fine job of keeping great data like this in perspective.
China will find much more, or already has; thing is we won’t know: to what extent can we trust Chinese government reports?
• China Finds $15 Billion of Loans Backed by Falsified Gold Trades (Bloomberg)
China’s chief auditor discovered 94.4 billion yuan ($15.2 billion) of loans backed by falsified gold transactions, adding to signs of possible fraud in commodities financing deals. Twenty-five bullion processors made a combined profit of more than 900 million yuan by using the loans to take advantage of the difference between onshore and offshore interest rates, and the appreciation of Chinese currency, according a report on the National Audit Office’s website. China is the biggest producer and consumer of gold.
Public security authorities are also probing alleged fraud at Qingdao Port where the same stockpiles of copper and aluminum may have been pledged multiple times as collateral for loans. As much as 1,000 tons of gold may be tied up in financing deals in China, in which commodities including metals and agricultural products are used to get credit amid restrictions on lending, according to World Gold Council estimates through 2013. “This is the first official confirmation of what many people have suspected for a long time — that gold is widely used in Chinese commodity financing deals,” said Liu Xu, a senior analyst at Capital Futures Co. in Beijing. “Any scaling back by banks of gold-backed financing deals might lead to a short-term reduction in Chinese imports and also spur some sales by companies looking to repay lenders.”
Let’s hope so.
• Britain and Europe Are Heading for a Divorce (Bloomberg)
The Juncker affair is only partly Cameron’s fault. Although he picks the wrong fights and his manner is grating, there’s a deeper problem that the other EU governments seem incapable of recognizing. Juncker illustrates it perfectly. Cameron was tactically inept, but he’s right on the merits of the appointment: Juncker’s accession would move the EU two strides further in the wrong direction. First, Juncker is a federalist, a believer in the “ever closer union” inscribed in EU treaties. As head of the European Commission — the union’s powerful executive branch — he’ll be in a good spot to advance that purpose. He’ll be deaf to the idea that Europe needs more “subsidiarity” (the principle that powers that don’t need to be centralized shouldn’t be) and hence to Britain’s main preoccupation.
Second, his appointment would be a coup for the European Parliament. Under current rules, national governments decide who leads the commission, and the understanding has been that this choice is made by consensus (that is, unanimously). The parliament, which wants Juncker, has no more than an advisory role. Yet it’s being allowed to insist on Juncker, despite the misgivings of other leaders, and even though that overrides Britain’s tacit veto. It’s a perfect example of the very syndrome that infuriates Brits: the unlegislated drift of power from national governments to EU institutions. And it comes — in the name of EU democracy, mind you — after EU-wide elections in which parties opposed to that drift made great gains.
As a result, Cameron’s difficulties over Europe are rapidly compounding. His position requires him to argue that Europe is reformable; Europe is telling the world it isn’t. How many of these rebuffs can Cameron absorb before he has to acknowledge that the U.K.’s choice is not between a new, less centralized union and divorce, but between divorce and the union as it is (only more so)? In effect, he’s already cast aside the argument that Britain has a compelling interest in remaining an EU member on almost any terms. If he believed that, he wouldn’t have promised a referendum in the first place.
Anyone know the French word for crack?
• France Refuses to Include Drugs and Prostitution in Its GDP (Slate)
The government of France has just made what on the face of it appears to be a nonannouncement announcement: It will not include illegal drugs and prostitution in its official calculation of the country’s gross domestic product. What made the announcement odd was that it never has included such activities, nor have most countries. Nor do most governments announce what they do not plan to do. (“The U.S. government has no intention of sending a man to Venus.”) Yet the French decision comes in the wake of significant pressure from neighboring countries and from the European Union to integrate these activities into national accounts and economic output. That raises a host of questions: Should these activities be included, and if those are, why not others? And what exactly are we measuring – and why?
Few numbers shape our world today more than GDP. It has become the alpha and omega of national success, used by politicians and pundits as the primary gauge of national strength and treated as a numerical proxy for greatness or the lack thereof. Yet GDP is only a statistic, replete with the limitations of all statistics. Created as an outgrowth of national accounts that were themselves only devised in the 1930s, GDP was never an all-inclusive measure, even as it is treated as such. Multiple areas of economic life were left out, including volunteer work and domestic work. Now Eurostat, the official statistical agency of the European Union, is leading the drive to include a host of illegal activities in national calculations of GDP, most notably prostitution and illicit drugs.
The argument, as a United Nations commission laid out in 2008, is fairly simple: Prostitution and illicit drugs are significant economic activities, and if they’re not factored into economic statistics, then we’re looking at an incomplete picture—which in turn will make it that much harder to craft smart policy. Additionally, different countries have different laws: In the Netherlands, for instance, prostitution is legal, as is marijuana. Those commercial transactions (or at least those that are recorded and taxed) are already part of Dutch GDP. Not including them in Italy’s or Spain’s GDPs can thus make it challenging to compare national numbers. That is why Spain, Italy, Belgium, and the U.K. have in recent months moved to include illegal drugs and nonlicensed sex trade in their national accounts.
Being a pundit is so much easier if you just repeat what others tell you.
• Why Financial Reporters Are Clueless (Stockman)
This morning’s Q1 GDP revision might have been a wake-up call. After all, clocking in a -2.9% – cold winter or no – it was the worst number posted since the dark days of Q1 2009. Well, actually, it was the fourth worst quarterly GDP shrinkage since Ronald Reagan declared it was morning again in American 30 years ago. Stated differently, 116 of the 120 quarterly GDP prints since that time have been better. Even when you adjust for the Q1 inventory “payback” for the bloated GDP figures late last year, real GDP still contracted at a -1.2% annually rate.
Still, within minutes of the 8:30AM release, the Wall Street Journal’s news update did not fail to trot out the “do not be troubled” mantra. Not only did “…early second-quarter data indicates the economy has improved this spring as warmer weather helped release some pent-up demand” , but the reader was also advised in a declarative sentence that the US economy’s real growth capacity is far higher, implying that Q1 results were some kind of freakish aberration:
…growth over the first six months of the year likely fell below….. the U.S. economy’s longer term growth rate of just over 3%.
Well, here’s real GDP since the turn of the century. The average real growth rate is about 1.8%—-barely half the cited figure. So where does the 3% growth rate for “potential GDP” come from, then? The answer is that it’s Keynesian writ, and the pretext for the Fed’s endless monetary “accommodation”. But doesn’t an actual 14-year trend trump theories that have become self-evidently irrelevant and macro-models that have been chronically wrong? In fact, the 3% potential GDP growth narrative is mocked by the fundamental arithmetic of true economic growth – which is to say, labor hour gains and capital investment.
Always useful.
• The Pocket Guide To Understanding The Different Schools Of Economics (Chang)
From the man who brought you “the shortest economic textbook in the world“; and “13 things Economists won’t tell you“, here is Ha-Joon Chang’s ultimate pocket guide to the differences (and similarities) between all the economic schools of thought.
As Chang discusses in his new book,Despite what the experts want you to believe, there is more than one way of ‘doing’ economics People have been led to believe that, like physics or chemistry, economics is a ‘science’, in which there is only one correct answer to everything; thus non-experts should simply accept the ‘professional consensus’ and stop thinking about it. Contrary to what most economists would have you believe, there isn’t just one kind of economics – Neoclassical economics. In fact there are no less than nine different kinds, or schools, as they are often known. And none of these schools can claim superiority over others and still less monopoly over truth. I accept that being suddenly asked to taste nine different flavours of ice cream when you had thought that there was only one plain vanilla can be quite overwhelming. In order to help, the simple table below should help you overcome your initial fear.

Nice.
• The Psychology of Never Saying “No” (Colas)
“Never tell your CEO ‘No’.” I heard that bit of wisdom today from a veteran investor relations professional. He was speaking at a conference about the role of IR in the capital markets and inside of corporations, and he paused for effect after he said it. He clearly wanted the audience to know he was passing along an important corporate life lesson, and he wanted to make sure we all heard him. At first blush, it seemed like something that a typical business/political animal might say. Someone, perhaps, who had fought all the usual wars inside large enterprises and come out victorious. Or at least not been fired.
As he spoke further, however, it became clear that he was not espousing the kind of Yes-man obsequious behavior we all take as a sign of both a broken corporate culture and personal weakness. Far from it, in fact. It is part of the IR professional’s job to deliver tough news to the company’s C-level officers. You just never use the word “No” as you dish out the tough love. That was his message. A quick review of the psychological literature on the word “No” explains the wisdom of his warning. Essentially, when a human being hears the word, they begin to shut down. The need for approval is so deeply ingrained in our inherently social natures that the word “No” conjures up early childhood memories of parental control and lack of approval. If this all feels a little Freudian, fear not – the data exists to back up these observations.
A study in the journal Emotion (Alia-Klein, Goldstein, and Volkow 2007) explains some of how this works. The researchers put 23 healthy adult males in a Functional Magnetic Resonance Imaging (fMRI) machine, which records regional brain activity, and exposed the subjects to repeated vocalizations of the words “Yes” and “No”. A summary of their findings and interpretations follow here:
The hypothesis tested was that humans learn the meanings of “Yes” and “no” very early in life, while their brains are still developing. As such these words acquire special emotional and motivational meaning. The word “No” is especially powerful, since it means the listener is unlikely to get what they want right away. By asking the subjects to press a button immediately upon hearing the two words, researchers found that the subjects process the word “Yes” more quickly than the word “no”. The difference is small – 78 milliseconds on average, or just shy of a tenth of a second – but it is measurable and consistent.
The brain scans show that that both words “Light up” parts of the brain that house emotion, showing that both “Yes” and “No” have special significance. The researchers also asked the subjects of the study to rate the words for their emotional significance, and the responses confirmed that both carry a lot of baggage. Other words used in the study, like “Up” and “Ten” did not elicit such responses.
Psychological research into the power of negative emotional stimulus supports this small word’s outsized power on our psych. A few other related studies on stimulus like facial expression – because who says “No” with a smile? – support the argument that “No” means trouble.
Interview.
• David Stockman on the Fed and War -and More- (Stockman)
David Stockman, budget director under Ronald Reagan, talks about the relationship between the Fed and war; his candid assessment of Reagan; his conversion away from leftism; and his current assessment of the economy.
Too many “leaders in that commission, who’ve made careers out of pushing the ocean to the brink in the first place.
• Report Warns World’s Oceans Pushed To Brink Of Collapse (Globe&Mail)
Former world leaders and ministers from countries around the globe say human activity has put the world’s oceans on a dangerous trajectory of decline and it is time to impose governance on the unclaimed high seas. The Global Ocean Commission, a body of 18 prominent former politicians and heads of major international organizations, released a report after 18 months of investigation that calls for a five-year “rescue package” for the 64% of the world’s oceans that lie outside national jurisdiction. Canada is represented on the commission by former prime minister Paul Martin, who was asked to be part of the initiative by commission co-chair Trevor Manuel, the former finance minister of South Africa. Mr. Martin said in an interview that it will not be easy to convince countries to take steps that will cause short-term economic pain, but those steps are necessary in the long term to protect regional stability, food security and the integrity of the oceans which the report calls “the kidney of the planet.”
“Inevitably, when you are dealing with the global commons,” Mr. Martin said, “the right thing to do becomes in the economic interests of everybody.” In the report, a copy of which was obtained by The Globe and Mail, the commissioners say human beings rely on the oceans for clean air, climate stability, rain and fresh water, transport, energy, food and livelihoods. But overfishing, pollution, habitat destruction, acidification and other human activities are pushing the ocean system to the point of collapse, they say. The report makes eight recommendations, including a call for a new agreement under the United Nations Convention on the Law of the Sea that would impose international governance on the massive expanse of unclaimed waters threatened by “benign neglect by the majority and active abuse by the minority.”
My bet: they’ll get it.
• Syngenta Seeks Emergency Exemption To Use Banned Toxin On UK Crops (Guardian)
Almost one-third of all oilseed rape in the UK could be treated with a banned insecticide if the government grants an “emergency” exemption to the pesticide manufacturer Syngenta, it has emerged. The agro-chemical company’s neonicotinoid pesticide was given a three-year ban by the European Union in 2013 due to research linking it to serious harm in bees. The news of Syngenta’s application comes a day after an international scientific review concluded there was “clear evidence of [neonicotinoid] harm sufficient to trigger regulatory action”. Neonicotinoids are the world’s most widely used insecticide and the panel said contamination was so pervasive it threatened global food production. “Syngenta has made this emergency use application on behalf of UK farmers for a limited use of neonicotinoid seed treatment in two specific contexts where alternative approaches are not effective and a danger to production exists,” said a company spokesman.
He noted that the application was supported by the government’s Advisory Committee on Pesticides (ACP), which confirmed the criteria for authorisation had been met. “Given this assessment we urge the government to support farmers and allow limited use this season.” Syngenta argues that seed treatments with neonicotinoids are needed to protect rape sown by mid-August from aphid damage and crops in areas where flea beetle pressure is historically high. It says there are no available alternatives. The exemption would allow up to 186,000 hectares of oilseed rape – 30% of the total crop area – to be planted with seeds treated with the insecticide. Bayer, another major neonicotinoid manufacturer, is not applying for an exemption.