Arnold Genthe Long Beach, New York Summer 1927
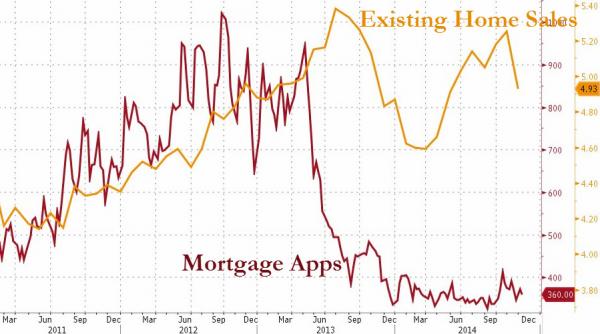
Oh yay, US Q2 GDP supposedly rose by 4%. Aw, come on. That’s only 7% more than in Q1 (or 6.1% in the once again revised Q1 number). Wonder what made that happen? Don’t bother. It’s complete nonsense. New home sales and lending home sales went down – again – recently, wages are not going anywhere, the ADP jobs report was – again – low today. There’s nothing that adds up to a 6% or 7% difference between Q1 and Q2.
The real story of the American economy lies elsewhere. The economy is sinking away in a debt quagmire. If it were a body, the economy would be in up to its neck in debt by now, with the head tilted backwards so it can still breathe. Barely. But your government doesn’t want you to know. There are a lot of things that illustrate this.
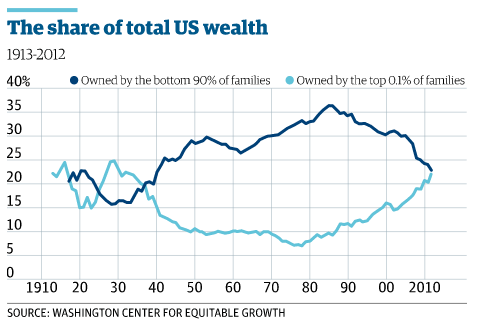
First , let’s go back a few days to the Russell Sage Foundation report, Wealth Levels, Wealth Inequality And The Great Recession, that I mentioned in Washington Thinks Americans Are Fools. I posted a pic from the report and said it “makes clear ‘recovery’ is about the worst possible and least applicable term to use to describe what is happening in the US economy”:
Households at the “median point in the wealth distribution – the level at which there are an equal number of households whose worth is higher and lower”, saw their wealth plummet -36% from 2003 to 2013. From the highest point, in 2007, to 2013 the number is -43%. Five years after 2008 and Lehman, five years into the alleged recovery, which raised US federal, Federal Reserve, and hence taxpayer, obligations by $10-$15 trillion or more, US median household wealth was down -36% from 2003. And that’s by no means the worst of it:
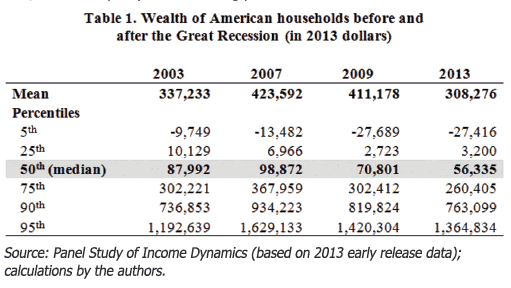
If you look at the 5th and 25th percentile ‘wealth’ numbers (much of it negative), you see that they went down from 2003 to 2007, while the median was still rising. For both, wealth in the 2003-2013 timeframe deteriorated by some -200% (or two-thirds, if you will). -$9,479 to -$27,416 for the poorest 5%, $10.219 to $3,2000 for the lowest 25%.
What I didn’t do was add up the numbers, and though when you’re using ‘median’ or ‘typical’, it’s hard to be sure about those numbers, we can derive some things from it that won’t be too far off. The -36% loss suffered between 2003 and 2013 by the ‘typical household’, which lowered the inflation-adjusted net worth from $87,992 to $56,335 (a loss of $31,657 per household), meant, assuming 120 million US households, that some $3.8 trillion in wealth went up in air. Because wealth (though partially virtual) went up from 2003 to 2007, the loss between 2007 and 2013 was larger: at $42.537 per household, the total loss came to $5.1 trillion. And don’t forget, that happened during the so-called ‘recovery’.
It should surprise no-one, therefore, that a report issued by the Urban Institute and the Consumer Credit Research Institute states that over a third of Americans in 2013 had debt in collection (i.e. reported to a major credit bureau). WaPo’s take:
A Third Of Americans With Credit Files Had Debts In Collections in 2013
About 77 million Americans have a debt in collections, a new report finds. That amounts to 35% of consumers with credit files or data reported to a major credit bureau, according to the study released Tuesday by the Urban Institute and Encore Capital Group’s Consumer Credit Research Institute. “It’s a stunning number,” said Caroline Ratcliffe, senior fellow at the Urban Institute and author of the report. “And it threads through nearly all communities.” The report analyzed 2013 credit data from TransUnion to calculate how many Americans were falling behind on their bills. It looked at how many people had non-mortgage bills, such as credit card bills, child support payments and medical bills, that are so past due that the account has since been closed and placed in collections.
Researchers relied on a random sample of 7 million people with data reported to the credit bureaus in 2013 to estimate what share of the 220 million Americans with credit files have debts in collection. About 22 million low-income adults who did not have credit files were not represented in the study. This is the first time the Urban Institute calculated the collection figure, but Americans may have been struggling with debt for a while: Researchers noted that the 35% is basically unchanged from when the Federal Reserve studied the issue in 2004 and found that 36.5% of people with credit reports had debt in collections. The debts sent to collections ranged from $25 on the low end and to more than $125,000 on the high end. [..]
… not all consumers get hassled: some people may not even learn they’ve been sent to collections until they check their credit reports, the study noted. That doesn’t mean the debts didn’t cause any setbacks. Bills that are sent to collections can stay on a person’s credit report for up to seven years, hurting a consumer’s credit score and in turn hindering their chances of accessing loans, credit cards and other forms of borrowing. A bad credit score can also hurt a person’s ability to land a job or their odds of getting approved for an apartment [..]
Note that not all debt is included, and perhaps quite a lot is not: in the gutters of America, there are for instance 22 million low-income Americans who don’t even have a credit file. They are most likely to use things like payday loans, which are also not included. But there is more slipping through the reporting cracks, as I noticed the end of the WaPo piece unveils, just like Tyler Durden did:
Deadbeat Nation: A Shocking 77 Million Americans Face Debt Collectors
But how is it possible that tens of millions of Americans are in such dire straits? After all, banks have been reporting better delinquency data for years. The answer: the study found that the share of people with debt past due, meaning they are at least 30 days late with payment on a non-mortgage debt, was much smaller: 1 in 20 people. That includes people who are late with credit card bills, student loan payments and auto loans. The majority of those people, 79%, also had debt in collections. However, because certain bills, such as medical bills and parking tickets, may not show up on a person’s credit score until they are sent to collections, the total share of people falling behind on their bills may actually be much higher.
… the stunner is that the share of Americans with debt in collections is 7 times greater than those with merely debt past due …
I’ll add something else: since only 220 million of the 320 million Americans have a credit file, it’s safe to assume that if you add dependents, children, close to 120 million Americans, perhaps even more (an average of one for every household), live in a household that has debt so far past due that debt collectors have been notified. In other words, not just debt, but bad debt.
AP points out the link to the jobs market and wages:
The Urban Institute’s Ratcliffe said that stagnant incomes are key to why some parts of the country are struggling to repay their debt. Wages have barely kept up with [rising prices] during the five-year recovery, according to Labor Department figures. And a separate measure by Wells Fargo found that after-tax income fell for the bottom 20% of earners during the same period.
But what I find more interesting is the positive twist USA Today manages to give to the story (just when you thought all was lost, here comes the cavalry):
A Third Of Americans Delinquent On Debt
When it comes to overall debt levels, most comes from mortgages, which make up 70%, on average, of Americans’ debt load. Wealthier states tend to have the highest amount of debt and percentage of debt held in mortgages, but the researchers point out that Americans with higher debt may also have higher incomes and better access to credit.
Isn’t that just a swell trick? The report the paper comments on is about the 77 million Americans who have debt in collection, but before you know it they switch to overall debt, and insinuate that because a lot of it is in mortgages, things are not that bad. And the trick gets better, even one of the report’s authors gets sucked in:
“Total debt really mimics mortgage debt,” says Caroline Ratcliffe, a senior fellow at the Urban Institute and one of the authors of the report. Ratcliffe classifies mortgage debt as what’s generally considered “productive debt.” “We talk about credit and access to credit as a good thing, but debt as a bad thing,” she says. “Access to credit can result in productive debt that moves us forward.”
I read somewhere the past week that credit is, in principal, good, and it’s the American way etc. And as we see here, mortgage debt is seen as productive, even by the report’s authors. But that’s not what the report was about!! (picture me shouting here).
I think that in today’s economy it’s a grave mistake to classify all mortgage debt as productive. I definitely see that as an idea of long lost times. After all, the same classification must have been used in 2007, but then right after a lot of that mortgage debt turned sour. It wasn’t so productive after all.
To see debt as productive, you have to have the expectation that it’s going to make money for the debtor. Or better yet, actually produce something of value. And to think that today’s mortgage debt will produce profits, you need the idea that home prices will rise.
But when you look at the wealth loss suffered by Americans as seen above, and you combine that with the huge rise in bad debt, where would you want to get that rise in home prices from? There’s only one place, isn’t there: more debt. And that trick won’t wash ad infinitum.
Classifying all of today’s mortgage debt as productive, de facto seeks not just to redefine the word productive, but to turn it on its head.
There’s one sector of the US economy that is going kind of strong: car sales. But why do you think that is? That’s right: debt. Is car debt classified as productive too, perhaps? Bloomberg:
Is Your Car an Underwater Time Bomb?
Even as job and wage growth have stagnated, auto sales have uncoupled themselves from those traditional economic drivers to become one of the few sources of strength in the macroeconomic picture. As the economists Amir Sufi and Atif Mian point out in their new book “House of Debt,” one of the big factors supporting overall retail spending in the U.S. since 2008 has been the expansion of auto credit. Sufi and Mian don’t celebrate this fact – they rightly see it as a symptom of broader secular stagnation in the U.S. economy. Indeed, a few recent statistics demonstrate the very precarious underpinnings of the auto industry’s prosperity:
- The average auto-loan term has increased every year since 2010, reaching 66 months in the first quarter of this year, according to Experian Automotive. In the same period, loans with terms of 73 to 84 months grew 28%, while loans with terms from 25 to 72 months actually fell.
- Equifax reports that U.S. auto loan volumes are at an all-time high, with some $902.2 billion outstanding at the end of the first half of 2014, up 10% year-over-year.
- The New York Times reports that subprime auto loans have grown by 130% in the last five years, with subprime lending penetration reaching 25% last year.
- Leases make up another quarter or so of auto “retail sales” according to Experian, another metric that is currently at all-time highs.
- 27% of trade-ins on new vehicle purchases in Q1 2014 had negative equity, according to the Power Information Network, another troubling indicator on the rise in recent years.
With half of new car sales supported either by leases or subprime credit, and ballooning loan terms leaving an increasing number of new car buyers underwater on their trade-ins, it’s clear that auto demand is hardly at a sustainable, organic level. Last year, 38.8% of dealer profits came from financing operations, according to the National Automobile Dealers Association, and General Motors has relied on some $30 billion in largely subprime receivables held by its GM Financial unit to show an increase in revenue in the first two quarters of this year.
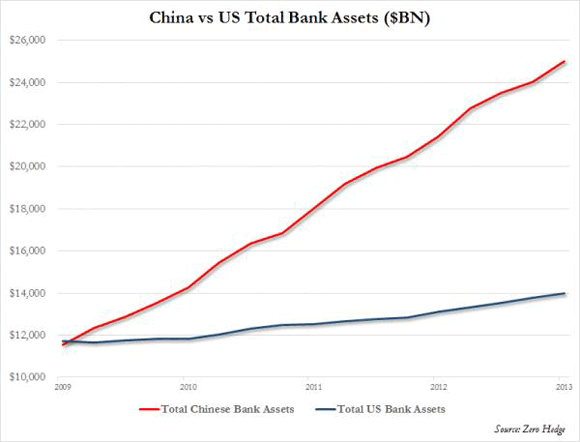
The only thing that keeps the American economy from collapsing outright and face first in this debt crisis is more debt. And it’s not just America: China, Japan, UK, they’re all on the same path, while Europe, once deflation sets in, will have to follow suit or break into smithereens.
And what should make me believe that Putin has not already had his economic team figure out a sweet spot for gas delivery to Europe, where he can reduce volume and let the Europeans fight amongst themselves over what’s left, and at the same time still keep his profits rising?
With a 4% official GDP number, the Fed has no choice but to keep up the taper. And I don’t think it would even want to have that choice. In the current geopolitical environment, which the US has largely created all by itself, making fewer dollars available in global markets can work wonders for the American dreams of empire.
The amount of dollar-denominated debt emerging economies have ‘engaged’ in will in short order devastate many of them, Europe will have a very hard time, and Japan will sink into oblivion (and perhaps try to shoot its way out). The BRICS’ plans to start their own bank will only hasten US determination.
Yellen doesn’t have to make a decision to raise rates, all she has to do is taper and rates will rise by themselves. If she raises rates on top of that, it’ll be a matter of weeks or months for many nations, companies and individuals.
Higher rates will stab the global economy in the heart, including US citizens, but they will boost the – dreams of – empire. For a while. But then, as the sanctions on Russia, based on at best paper thin and at worst entirely fabricated allegations, make abundantly clear, we’ve entered a new age. The pie is shrinking, and ever more people are clamoring for the ever fewer pieces of that pie.
Debt can only carry us so far, and that’s not a huge distance either; the game stops when the combination of principal and interest payments grows over debtors’ heads, as many of you can attest to. The taper alone will cause many to reach that point of no return; it will push a billion people, or two, over the brink. Argentina’s default is but the first of many.
What’s more important now is that fossil fuels, too, have a limited ‘carrying capacity’. And the planet. It’s going to be all cats in a sack from here on in, with everyone jockeying for a handful of rotting, dwindling and crumbling musical chairs. A 4% US GDP print is but a sidenote in that; it merely serves to avert people’s eyes away from their real futures. But then, Americans are no longer used to looking at those anyway. They’re not exactly a people with a strong link to reality.


• A Third Of Americans With Credit Files Had Debts In Collections in 2013 (WaPo)
About 77 million Americans have a debt in collections, a new report finds. That amounts to 35% of consumers with credit files or data reported to a major credit bureau, according to the study released Tuesday by the Urban Institute and Encore Capital Group’s Consumer Credit Research Institute. “It’s a stunning number,” said Caroline Ratcliffe, senior fellow at the Urban Institute and author of the report. “And it threads through nearly all communities.” The report analyzed 2013 credit data from TransUnion to calculate how many Americans were falling behind on their bills. It looked at how many people had non-mortgage bills, such as credit card bills, child support payments and medical bills, that are so past due that the account has since been closed and placed in collections.
Researchers relied on a random sample of 7 million people with data reported to the credit bureaus in 2013 to estimate what share of the 220 million Americans with credit files have debts in collection. About 22 million low-income adults who did not have credit files were not represented in the study. This is the first time the Urban Institute calculated the collection figure, but Americans may have been struggling with debt for a while: Researchers noted that the 35% is basically unchanged from when the Federal Reserve studied the issue in 2004 and found that 36.5% of people with credit reports had debt in collections. The debts sent to collections ranged from $25 on the low end and to more than $125,000 on the high end. Many consumers were burned for relatively small amounts – about 10% of the debts were smaller than $125, Ratcliffe says. But the median debt, $1,350, is still pretty substantial, she adds.
The phrase “debt collection” normally brings to mind dealing with harassing phone calls, repeated letters and other efforts from third parties attempting to collect the payment. But not all consumers get hassled: some people may not even learn they’ve been sent to collections until they check their credit reports, the study noted. That doesn’t mean the debts didn’t cause any setbacks. Bills that are sent to collections can stay on a person’s credit report for up to seven years, hurting a consumer’s credit score and in turn hindering their chances of accessing loans, credit cards and other forms of borrowing. A bad credit score can also hurt a person’s ability to land a job or their odds of getting approved for an apartment, Ratcliffe says. “This could impact you in multiple ways,” she adds.
The study found that the share of people with debt past due, meaning they are at least 30 days late with payment on a non-mortgage debt, was much smaller: 1 in 20 people. That includes people who are late with credit card bills, student loan payments and auto loans. The majority of those people, 79%, also had debt in collections. However, because certain bills, such as medical bills and parking tickets, may not show up on a person’s credit score until they are sent to collections, the total share of people falling behind on their bills may actually be much higher. The report did not break down which types of bills were most likely to be sent to collections and researchers could not distinguish between debts that were sent to collection years ago and those that were added more recently.
Read more …
• Is Your Car an Underwater Time Bomb? (Bloomberg)
America has had a rocky recovery from the 2007-08 financial crisis, but one group of Americans has done quite well: car dealers. Even as job and wage growth have stagnated, auto sales have uncoupled themselves from those traditional economic drivers to become one of the few sources of strength in the macroeconomic picture. As the economists Amir Sufi and Atif Mian point out in their new book “House of Debt,” one of the big factors supporting overall retail spending in the U.S. since 2008 has been the expansion of auto credit. Sufi and Mian don’t celebrate this fact – they rightly see it as a symptom of broader secular stagnation in the U.S. economy. Indeed, a few recent statistics demonstrate the very precarious underpinnings of the auto industry’s prosperity:
• The average auto-loan term has increased every year since 2010, reaching 66 months in the first quarter of this year, according to Experian Automotive. In the same period, loans with terms of 73 to 84 months grew 28%, while loans with terms from 25 to 72 months actually fell.
• Equifax reports that U.S. auto loan volumes are at an all-time high, with some $902.2 billion outstanding at the end of the first half of 2014, up 10% year-over-year.
• The New York Times reports that subprime auto loans have grown by 130% in the last five years, with subprime lending penetration reaching 25% last year.
• Leases make up another quarter or so of auto “retail sales” according to Experian, another metric that is currently at all-time highs.
• 27% of trade-ins on new vehicle purchases in Q1 2014 had negative equity, according to the Power Information Network, another troubling indicator on the rise in recent years.
With half of new car sales supported either by leases or subprime credit, and ballooning loan terms leaving an increasing number of new car buyers underwater on their trade-ins, it’s clear that auto demand is hardly at a sustainable, organic level. Last year, 38.8% of dealer profits came from financing operations, according to the National Automobile Dealers Association, and General Motors has relied on some $30 billion in largely subprime receivables held by its GM Financial unit to show an increase in revenue in the first two quarters of this year.
Read more …
From before Columbus: “Yields fell this low in Genoa in the 15th century but there has been nothing like this in Europe in modern times..”
• Europe’s Bond Yields Lowest Since 15th Century Genoa (AEP)
Bond yields have fallen to the lowest level in modern history in Germany, France and the eurozone’s core states, signalling a high risk of deflation and mounting concerns about sanctions against Russia. The yield on German 10-year bonds fell to a record low of 1.11pc in intra-day trading, partly on safe-haven flows. French yields dropped in tandem to 1.5pc. These levels are far below rates hit during the 1930s or even during the deflationary episodes of the 19th Century. “Yields fell this low in Genoa in the 15th century but there has been nothing like this in Europe in modern times,” said professor Richard Werner, from Southampton University. “This reflects the weakness in nominal GDP and a slow economic implosion caused by credit contraction. The European Central Bank is at last starting to act but it is only scratching the surface.”
German, French and Dutch yields have been sliding for months as the eurozone recovery wilts and several countries flirt with recession, but the latest plunge reflects a confluence of forces. “Investors may fear that the worsening tensions with Russia could be the external shock that finally pushes the eurozone into a deflation trap,” said Simon Tilford, from the Centre for European Reform. Bond yields have also fallen to all-time lows in Spain and Italy but the “risk-spread” over German Bunds has been widening over recent weeks. The cost of insuring Italy’s debt through credit default swaps has risen by a third since June.
European diplomats reached a deal on Tuesday on “tier 3” sanctions aimed at shutting Russian banks out of global capital markets and slowly suffocating the Russian economy, though the original plan to limit technology for oil and gas exploration has been diluted. Creditors have already frozen a $1.5bn loan for VTB bank due to be agreed last week. The European Commission said the measures are likely to cut 0.3pc of GDP off EU economic growth this year, and 0.4pc next year, even if the crisis is contained without a serious disruption of energy supplies. “This is a significant hit to growth. It implies such low growth in parts of southern Europe that it makes it almost impossible to arrest the rise in debt ratios,” said Mr Tilford.
The Moscow newspaper Izvestia said Russia’s parliament is already drawing up legislation to blacklist “aggressor countries”, specifically targeting auditors and consultants. These include Deloitte, KPMG, EY (formerly known as Ernst & Young), Boston Consulting and McKinsey. Tim Ash, from Standard Bank, said this would trigger clauses on bond covenants that rely on external audits. “If they go down this path they could provoke a brutal market reaction,” he said. David Owen, from Jefferies, said a lack of genuine economic recovery is what lies behind Europe’s falling yields, already replicating the pattern seen in Japan in the 1990s. “A third of all countries in the eurozone are already in deflation once you strip away taxes, and another four have no inflation, including France and Spain,” he said.
“Corporate profits fell in the first quarter, and so did household disposable income, if you exclude Germany. We are seeing no growth at all in world trade, which is highly unusual. The CPB trade index rolled over in May and fell 0.6pc,” he said. Mr Owen said investors are starting to price in quantitative easing by the ECB, which would entail sovereign bond purchases and potentially push yields lower. The Bundesbank would be the biggest buyer on a pro-rata basis under the ECB’s “key”, but German debt is relatively scarce. “Investors know this and it is driving Bund yields even lower,” he said. For Russia, deep recession looks inevitable. The commission said sanctions will cut Russia’s growth by 1.5pc in 2014, and by 4.8pc in 2015. A return to the Soviet stagnation of the early 1980s is becoming all too likely.
Read more …
No ZIRP here?!
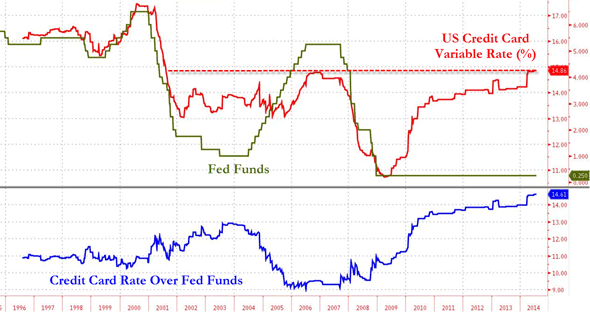
• US Credit Card Variable Interest Rates Highest Since July 2001 (Zero Hedge)
With 77 million Americans having debt past due and the average household owing more than $15,000 in credit card debt, it appears the Fed’s supposed plan to ‘help Main Street’ is not working so well. As the following chart from NewEdge’s Brad Wishak shows, despite Fed Funds at practically zero, US credit card variable interest rates continue to rise – now at their highest since July 2001.
Read more …
Interest rates.
• UK Personal Insolvency Storm Could Be Gathering (Guardian)
A big increase in the number of people becoming insolvent in England and Wales has prompted fresh warnings about the fate of financially stretched households when interest rates start to rise. There were 27,029 personal insolvencies in England and Wales in the second quarter, a 5.1% rise on a year earlier. The increase was driven by a 20% jump in the number of people entering into individual voluntary arrangements (IVAs) to a record high of 14,571, the Insolvency Service, which published the figures, said. Some experts said it was evidence that creditors were more confident about recovering debts in an improving economy. But others insisted it showed more families were on a financial knife-edge after years of falling real wages and government cuts. “Aside from all the talk of economic recovery, it’s clear that people are really struggling,” said Bev Budsworth, the managing director of The Debt Advisor.
She said hundreds of thousands of people were only just about making their monthly debt repayments because interest rates are still at a record low of 0.5%. But financial markets are pricing in a rate hike by the end of the year against a backdrop of stronger economic growth. “The acid test will be when the Bank of England starts to raise its base rate and people’s mortgage payments follow suit.” Brian Johnson, insolvency partner at the chartered accountants, HW Fisher & Company, said the figures showed Britons were shrugging off austerity and had been tempted to overextend. “With as many as a quarter of mortgage holders facing unaffordable payments if interest rates rise to a more normal level of 3%, a personal insolvency storm could be gathering,” he said.
Read more …
Time for Abe to leave. But he won’t.
• Japan’s Output Drops Most Since 2011 as Consumers Spend Less (Bloomberg)
Japanese industrial output fell the most since the March 2011 earthquake, highlighting the widening impact to the economy of April’s sales-tax increase. Industrial output dropped 3.3% in June from May, the trade ministry said today in Tokyo, more than twice the median forecast for a 1.2% contraction in a Bloomberg News survey of 31 economists. The manufacturing sector has cut back in response to a slump in consumer spending and a failure of exports to pick up even after an 18% drop in the yen last year. Honda Motor and Nissan Motor this week reported jumps in profit, showing how the weaker currency is contributing to earnings gains without bolstering the economy. “Today’s data are very ugly – companies are becoming even more cautious on the outlook for the economy after the sales-tax hike,” said Taro Saito, director of economic research at NLI Research Institute in Tokyo.
“Japan’s economy doesn’t have a driving force, with consumer spending and exports having stalled.” [..] Japanese production fell across most sectors, with transport equipment, which includes automobiles, dropping 3.4% from the previous month, and output of desktop computers, mobile phones and other communications equipment sliding 9%. Domestic demand, which had compensated for weak exports, fell off from April, and inventories rose in May as companies didn’t slow production much, contributing to the June output cut, according to Yasushi Ishizuka, a director in the trade ministry statistics department.
Read more …
• US Regulator Wants Monitors in Deutsche Bank, Barclays US Offices (WSJ)
New York’s banking regulator is pushing to install government monitors inside the U.S. offices of Deutsche Bank and Barclays as part of an intensifying investigation into possible manipulation in the foreign-exchange market, according to people familiar with the probe. The state’s Department of Financial Services notified lawyers for the two European banks earlier this month that it wanted to install a monitor inside each firm, based on preliminary findings in the agency’s six-month currencies-market probe, these people said. Negotiations are continuing over the details of the monitors’ appointments, but New York investigators expect to reach an agreement soon. The regulatory agency has selected Deutsche Bank and Barclays for extra scrutiny partly because the records it has collected so far from more than a dozen banks under its supervision point to the greatest potential problems at those two banks, the people said.
Plus, Deutsche Bank and Barclays are among the dominant players in the vast foreign-exchange market, so investigators hope a close-up view into their businesses will help them observe other players and trading patterns, the people said. A Barclays spokesman declined to comment; the U.K. bank previously has said it is cooperating with authorities. A Deutsche Bank spokesman said it is cooperating with investigators “and will take disciplinary action with regards to individuals if merited.” The New York regulator’s concerns about Deutsche Bank and Barclays are becoming the latest U.S. headaches for both banks. Barclays in 2012 settled U.S. interest-rate-rigging allegations, while an investigation into Deutsche Bank’s activities is continuing. Both banks have said they are cooperating with regulators looking into their so-called dark pools, or private stock-trading venues, including relationships with high-frequency trading firms. Barclays has settled charges that it violated U.S. sanctions, while Deutsche Bank still faces an investigation in that area.
Read more …
• Why Can’t the Banking Industry Solve Its Ethics Problems? (NY Times)
The financial crisis that nearly brought down the global economy was triggered in no small part by the aggressive culture and spotty ethics within the world’s biggest banks. But after six years and countless efforts to reform finance, the banking scandals never seem to end. The important question that doesn’t yet have a satisfying answer is why. Why are the ethical breaches at megabanks so routine that it is hard to keep them straight? Why do banks seem to have so many scandals — and ensuing multimillion dollar legal settlements — compared with other large companies like retailers, airlines or manufacturers? Some of the world’s leading bank regulators are trying to figure that out. And they have taken to sounding like parents who have grown increasingly exasperated at teenage children who keep wrecking the family car. This week, it was the turn of Mark Carney, the governor of the Bank of England. The latest British banking scandal was enough to make Mr. Carney, a former Goldman Sachs investment banker, sound like an Occupy Wall Street populist.
Lloyd’s Banking Group stands accused of manipulating a key interest rate to reduce what it would owe the Bank of England in a program meant to spur lending in Britain. “Such manipulation is highly reprehensible, clearly unlawful and may amount to criminal conduct on the part of the individuals involved,” Mr. Carney wrote to the head of the bank. (Pro-tip: If you are going to manipulate interest rates to squeeze an extra few million bucks out of somebody, don’t make that somebody the entity that regulates you). Mr. Carney has company among top bank regulators. Bill Dudley, the president of the Federal Reserve Bank of New York, said in a speech last November that “there is evidence of deep-seated cultural and ethical failures at many large financial institutions.” The Financial Times reported this week that New York Fed officials were putting the screws to major banks in private meetings, insisting they strengthen their ethical standards and culture.
Read more …
What sort of country is it becoming?
• Australia Blindfolds Citizens With ‘Unprecedented’ Media Gag Order (RT)
WikiLeaks has accused the Australian government of blindfolding the public with the worst suppression order in “living memory.” The media gag bans Australian news outlets from reporting on a multinational corruption case for reasons of national security. The whistleblowing organization published the details of the “unprecedented” gag order issued by the Australian government on Wednesday. The super injunction passed by the Supreme Court of the state of Victoria prohibits Australian media organizations from publishing material on a multi-million-dollar graft case involving high-ranking officials from Malaysia, Indonesia, Vietnam and the Reserve Bank of Australia (RBA). “The gag order effectively blacks out the largest high-level corruption case in Australia and the region,” said a statement published on WikiLeaks’ website.
The case pertains to RBA subsidiaries Securency and Note Printing who bribed the officials to secure lucrative contracts to supply bank notes to their governments. The gag order was issued after the secret indictment of seven senior executives from the RBA subsidiaries on June 19, writes WikiLeaks. The Australian government justifies the order as being in the interests of national security and prevention of “damage to Australia’s international relations.” However, WikiLeaks founder Julian Assange argues such an act of “unprecedented censorship” is unjustifiable. “With this order, the worst in living memory, the Australian government is not just gagging the Australian press, it is blindfolding the Australian public,” said Assange in a statement published on the WikiLeaks website. He called on Australia’s Foreign Minister Julie Bishop to explain “why she is threatening every Australian with imprisonment in an attempt to cover up an embarrassing corruption scandal involving the Australian government.”
Read more …
Outsmarting the west?!
• Ukraine Pipelines To Lose 50% Of Value When South Stream Line Starts (RT)
The South Stream gas pipeline, which bypasses Ukraine, may halve the value of Ukraine’s gas transportation system (GTS), according to Andrey Kobolev, head of Ukraine’s national oil and gas company Naftogaz. After the Russian–led South Stream project is complete and working at full capacity, the value of Ukraine’s GTS may fall as much 50% from the present estimate of $25-$35 billion, RIA Novosti quotes the head of the company. “We have no wish to lose it, and it’s unreasonable,” Kobolev said on a Ukrainian local TV channel.
Construction of the South Stream pipeline in Bulgaria and Serbia was suspended following pressure from the EU to comply with competition law. After a while construction resumed. “They [Gazprom] are ready to invest their own 15 billion euro in South Stream construction … This gas pipeline will take away from the Ukrainian transit potentially up to 60 billion cubic meters. Currently the transit carries 86 billion cubic meters,” Kobolev said. Previously 110-120 billion cubic meters were fed through Ukraine, but now the Nord Stream pipeline has taken a share of it, Kobolev explained, and concluded that once South Stream is operational Ukraine could be in a very difficult situation.
Read more …
Ouch.
• Housing Market in France in ‘Total Meltdown’ (Bloomberg)
French President Francois Hollande’s government may have made a housing slump worse, pushing the construction market to its lowest in more than 15 years. Housing starts fell 19% in the second quarter from a year earlier, and permits — a gauge of future construction — dropped 13%, the French Housing Ministry said yesterday. The rout stems from a law this year that seeks to make housing more affordable by capping rents in expensive neighborhoods. To protect home buyers, the law also boosted the number of documents that must be provided by sellers, leading to a decline in home sales and longer transaction times. While the government is now adjusting the rules, the damage is done, threatening France’s anemic recovery that’s already lagging behind those of the U.K. and Germany.
“Construction is in total meltdown,” said Dominique Barbet, an economist at BNP Paribas in Paris. “It’s difficult to see how the new housing law is not to blame.” Barbet says the drop in home building lopped 0.4 points off France’s gross domestic product growth last year and cut the pace of expansion by a third in the first quarter. Expenditure in the sector was at its lowest level ever as a portion of total real GDP in the first quarter at 4.7%, down from 6.3% in the first three months of 2007, he estimates. Sales of new-build homes fell 5% in the first quarter from a year earlier and are down by about a third compared with their level in 2007, according to Credit Agricole.
Read more …
• Best-Paid Finns Seek Jobless Aid as Recession Pain Widens (Bloomberg)
Finns once employed in the country’s highest paying jobs are now joining the ranks of the unemployed and asking the state for financial aid. “The crisis in the Finnish economy has hit especially high-productivity industries,” Juhana Brotherus, an economist at Danske Bank in Helsinki, said by phone. That means “the impact is harsher on gross domestic product than on unemployment.” The Nordic nation is reeling from body blows to its two biggest employers — the forest and technology industries. Its erstwhile largest company, Nokia, has sought to control debt growth by selling its mobile phone business to Microsoft Corp.
The U.S. company said this month the takeover will result in the loss of 1,100 Finnish jobs, or 20% of its workforce there, putting some of Finland’s best-qualified people out of work. Jobless claims soared 17.5% to €4.15 billion ($5.6 billion) last year, the Social Insurance Institution of Finland estimates. That’s the highest level since the 1990s, the last time Finland was dragged into a prolonged period of economic decline. Unemployment was 9.2% in June, not adjusting for seasonal swings, compared with 7.8% a year earlier, according to the statistics agency.
Read more …
That’s going to speed things up!
• Sixteen-Foot Swells Reported In Once Frozen Region Of Arctic Ocean (WaPo)
Big waves like those fit for surfing are not what we think of when contemplating the Arctic Ocean. The water is ice-covered most of the time — and it takes large expanses of open sea plus wind to produce mighty surf. So the fact that researchers have now measured swells of more than 16 feet in the Arctic’s Beaufort Sea, just north of Alaska, is a bit of a stunner. Swells of that size, researchers say, have the potential to break up Arctic ice even faster than than the melt underway there for decades thanks to rapid global warming. The wave measurements, using sensors beneath the surface communicating via satellite, were recorded by Jim Thomson of the University of Washington and W. Erick Rogers of the Naval Research Laboratory in 2012 and reported in an article in Geophysical Research Letters this year. “The observations reported here are the only known wave measurements in the central Beaufort Sea,” they wrote, “because until recently the region remained ice covered throughout the summer and there were no waves to measure.”
Sixteen feet was the average during a peak period, Thomson said in an email. “The largest single wave was probably” 9 meters, or about 29 feet, he said. The average over the entire 2012 season was 3 to 6 feet. The distances of open water change “dramatically throughout the summer season, from essentially zero in April to well over 1000 km in September,” they reported. “In recent years, the seasonal ice retreat has expanded dramatically, leaving much of the Beaufort Sea ice free at the end of the summer.” Because swells carry more energy, they reported, they will likely increase the pace of ice breakup in the region, eventually producing an “ice-free summer, a remarkable departure from from historical conditions in the Arctic, with potentially wide-ranging implications for the air-water-ice system and the humans attempting to operate there.”
Read more …
Redefining derivatives’ terms would make banks “less too big”. That means they acknowledge derivatives still are their main risk.
• Ending ‘Too Big to Fail’ Could Rest on Obscure Contract Language (Bloomberg)
Wall Street and global financial regulators, trying to squash the lingering perception that banks remain “too big to fail,” are looking to an obscure change in derivatives contracts to solve the problem. The main industry group for the $700 trillion global swaps market is rewriting international protocols to impose a “stay” or pause designed to prevent trading partners from calling in collateral all at once when a bank nears failure. U.S. and international banking regulators are considering making use of the new protocols mandatory, according to two people who spoke on condition of anonymity to discuss private meetings. The International Swaps and Derivatives Association is aiming to release the revised contract guidelines by November, the people said. The change is designed to prevent a recurrence of one of the most vexing problems revealed by the 2008 financial crisis: When Lehman Brothers Holdings Inc. failed, counterparties trying to unwind derivatives contracts touched off a panic that triggered a worldwide credit crisis.
The new protocol “puts another nail in the coffin of ‘too big to fail,’” Wilson Ervin, a senior adviser at Credit Suisse and the bank’s chief risk officer during the 2008 crisis, said in an e-mail. “Most banks want to get this done and are working hard for a good solution.” [..] U.S., U.K. and European regulators, still wrestling with the aftermath of the financial crisis, have held months of discussions aimed at buttressing the new and untested system for dismantling failing banks that was built by the Dodd-Frank Act and similar efforts in other countries. Some lawmakers and many participants in the market remain skeptical that regulators are really prepared to let a systemically large firm fail. In addition to the regular bankruptcy process, Dodd-Frank created a separate “liquidation” authority that the FDIC could use to seize and take apart a firm if a bankruptcy would shake the wider financial system.
However, as a U.S.-focused law, Dodd-Frank didn’t have the authority to solve the question of how to treat derivatives contracts as part of that process, in part because so many of them are international. Derivatives were already exempt from the stay that normally applies during bankruptcy; financial firms had successfully argued for decades that the financial system would be more stable and risks would be contained if traders could immediately end deals with a failing institution. Lehman’s failure exposed that argument as flawed. When it filed for bankruptcy, Lehman had more than 900,000 derivatives positions and its counterparties moved immediately to terminate trades and demand collateral. The new terms for the ISDA contracts would bar a firm from ending swap trades with a bank being put into liquidation for 24 or 48 hours, depending on which country’s laws apply. That would give regulators time to move the contracts to a new company, limiting contagion to the larger financial system.
Read more …
There are some brave people out there.
• Canadian Ebola Doctor (Not?!) In Self-imposed Quarantine (CTV)
A spokesperson for the Christian relief organization Samaritan’s Purse says a Canadian doctor is not in self-imposed quarantine after treating patients in West Africa for Ebola. The group earlier said Dr. Azaria Marthyman of Victoria, B.C., had voluntarily quarantined himself after spending nearly a month treating patients for the deadly disease. “Dr. Marthyman has assured us that (‘self-imposed quarantine’) is not a correct term to be applied to this situation,” spokesperson Jeff Adams told CTV News on Tuesday. Marthyman was among a handful of Canadian health-care workers who travelled to Liberia, one of three countries hit by the outbreak. He was part of a North American team from Samaritan’s Purse.
He worked at the agency’s facility in Liberia’s capital, Monrovia, before returning to Canada last Saturday. He has not tested positive for the disease. “Azaria is symptom-free right now and there is no chance of being contagious with Ebola if you are not exhibiting symptoms,” Melissa Strickland, a spokesperson for Samaritan’s Purse, had earlier told CTV Vancouver Island. Two Americans working in Liberia have come down with the disease, including one of Marthyman’s colleagues with Samaritan’s Purse, Dr. Kent Brantly. The 33-year-old married father of two children is undergoing intensive treatment for the disease, but has been able to speak with doctors and work on his computer.
Read more …
• Sierra Leone’s Top Ebola Doctor Dead After Contracting Virus (TIME)
Sierra Leone’s top Ebola doctor, Sheikh Umar Khan on Tuesday died from complications of the disease. His death came just days after three nurses who worked with him perished. Khan served on the front lines of what is now considered the worst Ebola outbreak in history, with 670 dead, primarily in West Africa. He is credited with treating more than 100 victims and has previously been hailed as a national hero. Now, hundreds of condolences are pouring in on Twitter, praising his courage and altruism. “Khan’s death is yet another recognition that health workers is the group most at risk,” Tarik Jasarevic, a spokesman with World Health Organization, tells TIME. More than 100 health workers have contracted the virus since the beginning of the outbreak and around half of them have died. “This is the first time most of these workers face such an outbreak. We have to equip them with protective gear and train them on how to use it.
We also need to make sure there are enough workers. If they work reasonable shifts they can focus not only on the patients, but also on themselves.” Sierra Leone is the country that has been worst hit by the latest outbreak, but neighboring Liberia is also struggling since the contagion breached its borders. The country’s overland border crossings have been closed since Sunday, and Doctors Without Borders reports that they are only able to provide limited technical support to Liberia’s Ministry of Health and Social Welfare. The fear is now that the deadly disease could also spread far beyond West Africa, possibly via air travelers. Medical services across Europe are on high alert because of the outbreak, and U.K. Foreign Secretary Philip Hammond told the BBC that the disease is a “threat” to his country. “There is a risk that the epidemic will spread, but first of all we need to stop it on the ground,” says Jasarevic. “We know exactly what needs to be done, but it requires a lot of resources.”
Read more …