Dec 182015
 
 December 18, 2015  Posted by at 6:15 pm Finance Tagged with: , , , , , ,


DPC Times Square seen from Broadway 1908

I was reading something yesterday by my highly esteemed fellow writer Charles Hugh Smith that had me first puzzled and then thinking ‘I don’t think so’, in the same vein as Mark Twain’s recently over-quoted quote:

“It ain’t what you don’t know that gets you into trouble. It’s what you know for sure that just ain’t so.”

I was thinking that was the case with Charles’ article. I was sure it just ain’t so. As for Twain, I’m more partial to another quote of his these days (though it has absolutely nothing to do with the topic:

“Eat a live frog first thing in the morning, and nothing worse will happen to you the rest of the day.”

Told you it had nothing to do with anything.

Charles’ article deals with money supply and the velocity of money. Familiar terms for Automatic Earth readers, though we use them in a slightly different context, that of deflation. In our definition, the interaction between the two (with credit added to money supply) is what defines inflation and deflation, which are mostly -erroneously- defined as rising or falling prices.

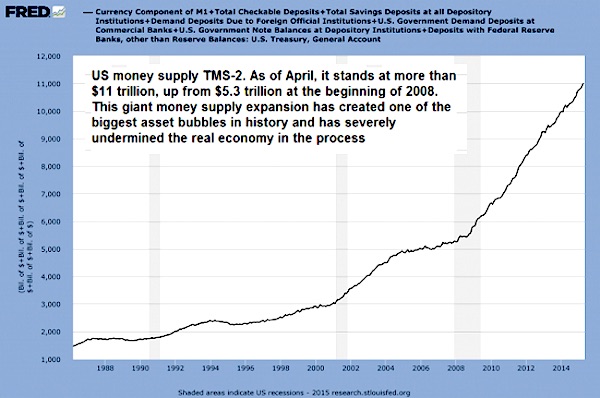
I don’t want to get into the myriad different definitions of ‘money supply’, and for the subject at hand there is no need. The first FRED graph below uses TMS-2 (True Money Supply 2 consists of currency in circulation + checking accounts + sweeps of checking accounts + savings accounts). The second one uses M2 money stock. Not the same thing, but good enough for the sake of the argument.

In his piece, Charles seems to portray the two, money supply and velocity of money, as somehow being two sides of the same coin, but in a whole different way than we do. He thinks that the money supply can drive velocity up or down. And that’s where I think that just ain’t so. I also think he defeats his own thesis as he goes along.

Before going into details, two things: One, he doesn’t mention the term deflation even once, though he shows money velocity has been going off a cliff like a mountain range and a half full of lemmings. I find that curious.

Two, he doesn’t mention consumers in the context. That can’t be right either. 70% of US GDP is consumers. You can’t ignore that. You can’t just look at financial markets, at investors, even though they use up most of the stimulus, and think they are the main factor determining money velocity. Not when they’re less than a third of GDP.

Moreover, and this I think is crucial, the velocity of money talks to you about consumers in a way that the money supply never could.

There may be ‘positive’ reports coming out of the BLS on jobs numbers, but with 94+ million Americans not in the labor force, with the quality of jobs diminishing so fast and so profoundly that the middle class is all but disappearing, and with 40+ million US citizens on foodstamps, the impact of the deteriorating spending power of ‘consumers’ on money velocity had to be so enormous you can’t ignore them.

Simply because if and when people have a lot less to spend, velocity comes down. That there is even the very heart of deflation. Here’s Charles with my comments:

Money Velocity Is Crashing – Here’s Why

The inescapable conclusion is that Fed policies have effectively crashed the velocity of money.

I’ll get back to that, but no, it is not true.

That the velocity of money has been crashing while the money supply has been exploding doesn’t seem to bother the mainstream pundits. There is always a fancy-footwork explanation of why whatever is crashing no longer matters. Take a look at these two charts and tell me money velocity doesn’t matter.

No argument about that from me.

First, here’s money supply: notice how money supply leaped from 2001 to 2008 as the Federal Reserve pumped liquidity and credit into the economy, and then how it exploded higher as the Fed went all in after the Global Financial Meltdown.

Now look at a brief history of the velocity of money. There are various measures of money supply and various interpretations of velocity, but let’s set those quibbles aside and compare money velocity in the “golden era” of the 1950s/1960s and the stagflationary 1970s to the present era from 2008 to 2015-the era of “growth”:

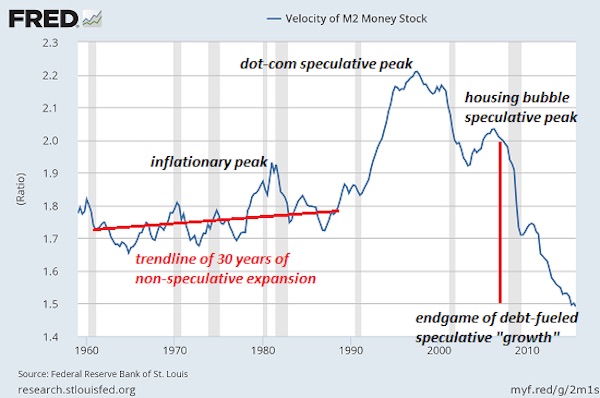
Notice how the velocity of money remained in a mild uptrend during both good times and not so good times. The inflationary peak of 1979-1982 (Treasury yields were 16% and mortgages were 18%) generated a spike, but velocity soon returned to its uptrending channel. The speculative excesses of the dot-com era pushed velocity to unprecedented heights.

Given the extremes in velocity, it is unsurprising that it quickly fell in the dot-com bust. The Federal Reserve launched an unprecedented expansion of money, credit and liquidity that again pushed velocity up in the speculative frenzy of the housing bubble. But note that despite the vast expansion of money supply, the peak in the velocity of money was considerably lower than the dot-com peak.

OK, that’s the core of why I started thinking I was sure it just ain’t so. What Charles asserts here is that an expansion of the money supply lifts the velocity of money. In other words, that the velocity of both the pre-existing supply AND the additional supply increases as more supply is added. Even BECAUSE it is added. The more money, the faster it moves. The bigger you get, the faster you run.

And I don’t see that. To me, it’s counterintuitive. This implied correlation does not exist. The velocity of money doesn’t rise when you pump more of it into an economy, it rises because people feel more confident about spending it. For whatever reason that may be.

What’s happening today, and what Charles neglects to mention, is that huge amounts of Americans simply no longer have money to spend. And no matter how much extra is pumped in through QE, it fails to reach them. Moreover, they’re all maxed out on debt. So even if they would get some extra, it would go towards debt repayment. And it does.

That’s what the money velocity graph tells us. Velocity began to tank around 1997, and apart from the housing bubble borrowing boom, has kept tanking until now. Beware of the differences between the graphs: the first one, money supply, runs from 1986 to 2015, while the second one, velocity, covers 1960 to 2015. So you can focus on the second part of graph no.2 to get them to line up.

And the first growth spurt in the velocity graph doesn’t correspond with a similar spurt in supply. In fact, the correlation looks pretty much inverse: the more supply, the less velocity. Apart from the housing casino boom blip perhaps. Which Charles attempts to address next:

Since the collapse of that speculative bubble, the Fed’s all-in expansion of money, credit and liquidity has failed to stem the absolutely unprecedented collapse of money velocity. Clearly, expanding money, credit and liquidity no longer generates any velocity.

That’s because it never has. Expanding money, credit and liquidity has never generated any velocity. It’s always been only about confidence – and private debt levels.

Rather, the inescapable conclusion is that Fed policies have effectively crashed the velocity of money.

No, that conclusion is not just not inescapable, it’s flat out wrong. Unless perhaps you would mean that the policies have greatly impoverished the consumer, but that’s not what Charles is saying. He doesn’t mention consumers. His point seems to be that in earlier days, increases in supply did indeed lead to increases in velocity, ostensibly in the financial world.

To the extent that policies, Fed or otherwise, have tempted Americans to enter the ‘investment casino’, one might claim that down the road, such policies have crashed velocity. But the money supply was not rising all that much when the dot.com bubble was happening, and when the real big supply kahuna came, velocity crashed.

Not because of Fed policies, but because of debt, and of people being maxed out. And one could, if one were inclined to do so, blame that as much on the repeal of Glass-Steagall as on the Fed.

How is this possible? Longtime correspondent Eric A. proposed an insightful explanation. Here is Eric’s commentary:

“You know how you say that the economy is locked up in fiefdoms, and they’re picking winners and losers, as part of colluding the prices? Well this adjustment of prices locks out certain people, like say, the young from housing. So houses don’t sell, they stagnate. But what are we really looking at? Velocity.

Velocity is an indicator that buyers and sellers agree on a price, that the price is “right” and not an outlier. That’s why you see a stock move on high volume “confirming” the move, because it means the price wasn’t “right” at the previous level, while more people agree the new price is fair.

If prices are allowed to go where they need to without pressure and manipulation, you will always have velocity, as the most buyers and sellers will always agree at some price. Because this is true, low velocity cannot happen in a free market.

That is half right, but only half. because it suggests that there’s always a price at which people will buy. There isn’t if people have no money to buy with. That’s why the housing market crashed the way it did, and would be much worse to this day without ZIRP tempting people once more into foolish purchases (foolish because ZIRP distorts markets, but can’t do that forever).

Which means the only reason for low velocity (in this or the previous Depressions) is that someone has somehow managed to get an edge that prevents them from selling, from liquidating, at the true price, i.e. the one the buyers will agree to.

This has another corollary, that the measure of velocity on the Fed’s own chart is the measure of the level of unnatural price manipulation on the market. We can watch this aggregate indicator of their failure in real time, by the Fed’s own hand, and we can know the manipulation is ending when it rises.

Sort of right, but… You can’t even begin to understand the velocity of money without including what consumers have to spend. That’s essentially what the velocity of money measures. What they have to spend plus how confident they are of having it to spend (again) tomorrow.

And you can throw in price manipulation, but that’s not the core, though it can’t be said to have zero influence. What’s certain is that the connection to Fed policies is very weak, if not tenuous. The Fed didn’t blow the housing bubble (money supply remained just about flat from 2005-2008), politics did.

So yes, the Fed, the governments, the insiders can manipulate to their heart’s content, as they’ve been doing, but that unnatural pressure goes somewhere. And the pressure diverts into velocity. As we saw in the Great Depression, or the Roman Empire, velocity can stagnate for 10, 20, or 1,000 years until the manipulation ends, property rights are restored, and we have a free market. History has shown that may be a bargain they’re willing to make, but it won’t do the rest of us a lot of good.”

Sounds about right, but ignores the role of millions of Americans with nothing left to spend. To repeat: 94+ million Americans not in the labor force, the quality of jobs diminishing so fast and so profoundly that the middle class is all but disappearing, and 40+ million US citizens on foodstamps.

There’s what’s the velocity of money graph reflects. And that part of that is due to manipulation, sure. But without including debt, the whole argument rings kind of hollow.

Thank you, Eric, for an explanation that intuitively rings true. Manipulating the PR optics (i.e. perception management) as a substitute for an open market doesn’t make you omnipotent, it makes you a hubris-soaked fool.

No argument on the last sentence, but that is not the core of what ‘just ain’t so’ here. You essentially can’t tell anything from the US velocity of money without looking at the American people.

Velocity of money does not rise because -or when- the money supply does, it rises when consumer spending does. And that happens when people feel confident. No additional supply is needed for that, just for money to move faster. And money doesn’t move faster just because -or when- there’s more of it.

Home Forums The Velocity of the American Consumer

Viewing 10 posts - 1 through 10 (of 10 total)
  • Author
    Posts
  • #25719

    DPC Times Square seen from Broadway 1908 I was reading something yesterday by my highly esteemed fellow writer Charles Hugh Smith that had me first pu
    [See the full post at: The Velocity of the American Consumer]

    #25720
    Variable81
    Participant

    @Illargi,

    I’m trying not to wrap this all in a blanket of Neoclassical economic thinking (mostly out of fear that Steve Keen might jump out from the shadows and whack me over the head with a copy of Debunking Economics!), but my mind drifts to the ‘totem’ of the Supply and Demand curve, where money velocity represents the Demand side of the equation (but only in terms of money being a medium of exchange).

    Without giving it any deep thought, it would seem to me that the ‘price’ of money falls when Supply is increased (i.e. massive credit expansion or outright money printing), but also when the Demand for money as a medium of exchange falls (i.e. when money starts to be hoarded as a store of value).

    Reversely, the ‘price’ of money seems to increase when Supply is decreased (i.e. debt defaults or outright destruction of money) or when the Demand for money as a medium of exchange increases (i.e. when goods and/or services becomes more desirable than holding onto money as a store of value).

    If any of that makes any sense then I wonder what happens when the desire/confidence to spend more and thus increase the velocity of money occurs but the money supply is insufficient to compensate? It makes me think of a saying Nicole seems to be fond of – Demand isn’t what you want but what you can afford.

    Back to Neoclassical economic thinking (*looks over his shoulder for Steve Keen*), it would seem what Charles is suggesting is true based on the accepted mathematical calculation for the Velocity of Money, Vt = nT/M, where Vt = the velocity of money for all transactions, nT = the nominal value for all transactions, and M = money supply.

    By that I mean that nT could be staying constant (even though I’m sure you would be right in arguing that it is declining) while M is increasing, resulting in a lower velocity of money. In a purely Neoclassical economic / mathematical sense, Charles is correct that Fed policies (which have themselves increased or at least permitted the increase of the money supply) have effectively crashed the velocity of money.

    #25721
    Dr. Diablo
    Participant

    It is true that velocity and supply are unrelated, but it is it true that consumers have *no* money? It’s probably more true to say they have a lot *less* “money” (cash+credit) than before, as they have no confidence and stopped borrowing. That’s exactly why prices have to drop. If they don’t drop to a point where the new consumer — i.e. he-who-hath-little-money — can buy them, then they don’t get bought. i.e. falling sales = falling exchange of money = velocity falls. But if prices were to drop enough — e.g. US houses fall from 6x income ($200k) to 1/6 income ($5k) then very probably even the new, poor worker would be able to buy one. Actually, that’s what happened in the 30’s Depression: in places property finally changed hands at –ZERO– value. You could own it if you could carry the taxes. Yet at that point property finally changed hands again, i.e. velocity normalized.

    But a $5k property value would require the existing owner to take a $195k “loss.” (quotes because it may have been a paper gain in the first place. It is, however, someone’s potential collateral) To avoid that loss and instant bankruptcy, and as many are banks who hold mortgages as collateral, they arrange a variety of tricks to prevent any attempt at market clearing, (as have other monopolies, medical, cable, insurance…) Then prices don’t fall, property doesn’t sell, and money then doesn’t change hands. That is to say, velocity is crippled. At $5,000 houses and 50c steaks, I wager money and property would start changing hands again. Even at a median income of $30k, with 100M Americans not in workforce. Prices would fall in line with wages, because without debt, one or the other must converge.

    The point is, at *some* price, everything will sell. So why are the sellers in charge of the prices? Why not the buyers? The sellers are stuck with the property and the carrying costs, without a buyer, their only option is to give it away for $0. So surely it’s the buyers who have the real power whether they are freely willing to buy or not? It’s buyers who make velocity and sellers who prevent it by holding out. So if you have an economy where all the political power is held by capital owners, i.e. the status quo, and little is held by the general public, i.e. workers and consumers, then the general public eventually goes on strike: they don’t buy anything. Capital owners demand them to buy, to buy healthcare or else, hand over their bank deposits with bail-ins, but as in Greece, that only makes them buy less out of protection and uncertainty. So we have one side forcing prices up politically, forcing sales to occur at gunpoint, and the other side hiding from them. The “hiding from them” part is velocity, as we see in Greece. I bet there’s a lot of money still in Greek cookie jars, a lot of capital tools in idle factories, a number of assets as collateral to borrow against, but everyone’s in hiding. As their capital is in hiding.

    These “capital hiders/hoarders” are the buyers. Until the prices fall to where the buyers feel safe buying, there is no velocity. Ever. 70 years in the Soviet Union. 700 years in the middle ages. Until you can get a fair price, one buyers agree to, who know they have property rights after the purchase, you will have no velocity. Why would you take precious capital out of hiding to overpay for assets that can be stolen because there’s no rule of law? Ever? Even at gunpoint, in Kiev or Sarajevo, at swordpoint in Rome, they buried the coins and the hordes are still being dug up. Velocity will normalize when there is again a *fair* exchange of buyers and sellers, without violence, coercion or price-fixing. Until then, you no longer have markets and the economy will remain crippled, forever, until it is fixed.

    As Ilargi says, you have a political problem, not a financial problem. Or put another way, you have a violence problem.

    #25722

    Variable,

    I think the velocity graph says plenty to prove the Neoclassical theory wrong. Put it this way: there’s nothing that says velocity has any direct connection with supply. It can go up or down while supply goes the opposite direction.

    #25723

    Daiblo,

    Yeah, Charles’ reader is not all wrong, there’s always a point at which ‘trade’ can start up again. Even if increasing amounts of people are locked out, there’ll be some who are not. But when homes can only trade at for example 1% of their building costs ($1000-$5000), we have a problem way beyond Houston. Detroit did it, though.. What I’m trying to say is that such a purely theoretical view is of little value out there. ‘There’s always some point ‘ means little if that point would bring down the entire economy.

    #25724
    rapier
    Participant

    I hate the word confidence in relation to economics. I’m not disputing IM when I say that it isn’t confidence with drives spending and velocity, it’s money. Confidence doesn’t drive spending, it is the other way around. Money in hand raises confidence.
    One is falling into a trap when you bring “confidence” into the discussion. The very trap Economics has fallen into. Again I don’t want to argue with IM but I think it is more than just semantics to raise this point. “Confidence” is a red herring, as we say in the USA. It is a show me the money economy.

    The money is trapped in the financial economy. In the old days when bank loans were the largest source of credit by far then the credit cycle did first see financial asset prices turn up first as credit expanded but the real people economy soon followed. Now so much credit goes directly into financial and other assets, and stays there. It isn’t a ‘confidence’ economy it is a show me the money economy. Confidence is the result of more money, not the other way around.

    On a deeper level it would be insane to want people in the rich developed world to want to spend more on stuff. We have enough stuff, poorly distributed to be sure. Evan at that however, and sadly borrowing a page from the reactionary right, even our poor are rich, by any historic standard. Economics isn’t going to save us.

    #25727
    koso_man
    Participant

    I think the reason velocity is going down is because the money supply is growing disproportionately to transactions and gnp thanks to QE.

    Think about it. There’s something like an extra 4 trillion dollars sit in bank reserves doing nothing thanks to the Fed. Take away that money supply and the velocity of money wouldn’t be crashing the way it is.
    In other words I don’t think velocity of money crashing tells us much about the health or illness of the consumer.

    #25728
    koso_man
    Participant

    In fact just taking another glance at the graphs above, look at the correlation between money supply growth and the crash in velocity…sorry illargi but I think chs is right. The fed has crashed the velocity of money. It doesn’t matter though because there are many other stats that show that the American consumer by and large is massively suffering. Isn’t the middle class now a minority for the first time in decades.

    #25729
    Yosef52
    Participant

    I keep hearing this “94 million people not in the labor force” stat, and it got me to wondering: Is this remotely true? Here’s a good discussion:
    https://www.politifact.com/truth-o-meter/statements/2013/jul/30/blog-posting/are-90-million-americans-not-working-or-looking-wo/
    From the link, breaking down the numbers:

    • People age 16 to 17, who likely are in high school: 9 million

    • People who are enrolled in either two- or four-year colleges: 21 million

    • People age 65 and older, who have reached retirement age: 40 million people

    That means 20 million people are of normal working age, not in college and not working. That’s less than one-quarter the amount repeatedly cited in the blogosphere.

    So the 90 million number is exaggerated. Even so, the idea that fewer people are joining the workforce is something that worries economists.

    #25738
    regionswork
    Participant

    Velocity is the term under discussion, but I’m not sure it captures individual or household economics, which are of course, different. In my work as a regional planner for 35 years, I used economic analysis as one tool in the development of recommended policies and programs for

    People for whom money “burns a hole in their pocket”, like my son, would be the velocity folks, gunning the throttle until the tank is empty. My daughter, on the other hand, would save – be more tempered in her use. That isn’t necessarily a brake. If it went into a bank, when banks actually needed deposits, it would be available for others that wanted to rent it. Credit is treated as money – and it used to be that, when its source was the savings of others.

    When credit extension creates money – the item value may be overstated (list price) and the interest adds to the profit. So a dollar down gets you a new car or whatever. Cash price that day might be $500, but with credit it might be $600 or more. Worth it in many circumstances, providing you have the income to pay off the principle and interest. The old rule of 78s gave the pre-payment penalty – extension of credit has costs. Vendor financing – GM, Sears, GE made finance the profit center.

    All this was useful when people managed their debt – and had savings. No over extension in terms of ability to repay. In home buying, the house was not an investment, but where you lived. If paid off by retirement, then only taxes and maintenance had to be covered. Most U.S. housing stock since the 1950’s was built for single family ownership, not rental. S-F housing is high maintenance – yardwork required; not the best style for people who move. Renters, being deemed not as good as homeowners, in some cases you couldn’t be on the planning commission or on a jury if you were not a property owner, that housing stock was unwanted. The high unefficiency of the American housing stock is one reason it is so expensive. Banks wanted zoning since the 1930’s to protect housing value so longer term loans could be made. The separation of uses to enable this created the unwalkable distances of the now entirely automobile dependent society.

    Somewhere in the 1980’s – 90’s, the economy shifted on debt from repay to re-fi(nance). The debt creating and recycling economy came into being. Costs rose faster than wages, so the difference was made up with credit. The more debt you had, the more you could get. As the finance fees, more than interest, was the income source, the more the better as far as the financial folks were concerned. Failure of individuals and households to be able to repay was fodder to raise interest rates beyond usury standards. That the vendors were being fraudulent in extending credit and should have had higher standards, well that wasn’t even a thought for those whose PRODUCT IS DEBT. (Apologies for shouting).

    So, I believe it is one of the basic thoughts of Nicole and The Automatic Earth that there is more debt, more claim on assets, than there are assets in the physical world. The living assets, debt slaves yet unaware of their condtion, will produce for quite a long time. The balance sheet method of accounting, rather than cash, can easily be balanced by the insertion of an asset valuation equal to or larger than the debt.

    Treading water is the velocity? Economies will shrink to the sustainable.

    The financial situation of the 1980’s led me to make a case for regional cooperation in a World Future Society paper. Credit magic somehow changed the dynamics, but in doing so – we are worse off in an existential sense. A new message from God would be useful, at least in providing direction. Here’s the paper REGIONAL COUNCILS: Today’s Governmental Tool for the 21st Century (1986)

Viewing 10 posts - 1 through 10 (of 10 total)
  • You must be logged in to reply to this topic.