

Rene Magritte Memory 1944

Many scary graphs today. Let’s start here.
• Last Two Times After US Reported Data Like This, Stocks Crashed (WS)
The BEA offers various measures of corporate profits, slicing and dicing them in different ways. One of them is its headline number: “Corporate profits with inventory valuation and capital consumption adjustments.” It estimates “profits from current production,” based on profits before taxes, not adjusted for inflation, but with adjustments for inventory valuation (IVA) and capital consumption (CCAdj).These adjustments convert inventory withdrawals and depreciation of fixed assets (as they appear on tax returns) to the current-cost economic measures used in GDP calculations. It’s a broad measure, taking into account profits by all corporations, not just the S&P 500 companies. This measure is reflected in the first chart below.
Later, we’ll get into after-tax measures without those adjustments. They look even worse. In Q4, profits rose to $2.15 trillion seasonally adjusted annual rate. That’s what the annual profit would be after four quarters at this rate. But profits in the prior three quarters were lower. And so Q4 brought the year total to $2.085 trillion. This was down from 2015, and it was down from 2014, and it was up only 2.6% from 2013, not adjusted for inflation. This 20-year chart shows that measure. Note that the profits are not adjusted for inflation, and there was a lot of inflation over those 20 years:

Things get even more interesting when we look at after-tax profits on a quarterly basis. The chart below shows two measures: Dark blue line: Corporate Profits after tax without adjustments for inventory valuation and capital consumption (so without IVA & CCAdj). Light blue line: Corporate Profits after tax with adjustments for inventory valuation and capital consumption (so with IVA & CCAdj). Q4 profits, at a seasonally adjusted annual rate, but not adjusted for inflation, were back where they’d been in Q1 2012:
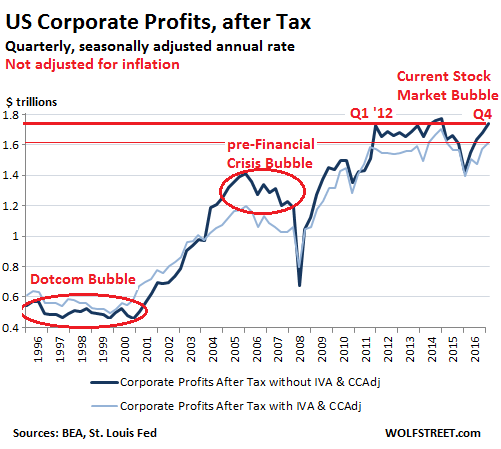
By this measure, corporate profits have been in a volatile five-year stagnation. However, during that time – since Q1 2012 – the S&P 500 index has soared 70%. [..] The chart also shows that there were two prior multi-year periods of profit stagnation and even decline while the stock market experienced a massive run-up: from 1996 through 2000, leading to the dotcom crash; and from 2005 through 2008, which ended in the Financial Crisis. This peculiar phenomenon – soaring stock prices during years of flat or declining profits – is now repeating itself. The end point of the prior two episodes was a lot of bloodletting in the markets that then refocused companies – the survivors – on what they needed to do to make money. For a little while at least, it focused executives on productive activities, rather than on financial engineering, M&A, and similar lofty projects. And it showed in their profits.
People have no money to spend. But they do need a car in the US.
• One Third Of US Car Loans Is Deep Subprime (Roberts)
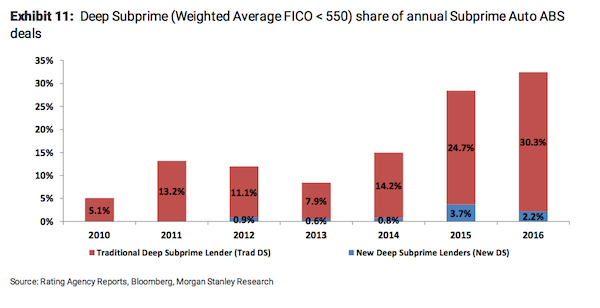
Given the lack of wage growth, consumers are needing to get payments down to levels where they can afford them. Furthermore, about 1/3rd of the loans are going to individuals with credit scores averaging 550 which carry much higher rates up to 20%. In fact, since 2010, the share of sub-prime Auto ABS origination has come from deep subprime deals which have increased from just 5.1% in 2010 to 32.5% currently. That growth has been augmented by the emergence of new deep sub-prime lenders which are lenders who did not issue loans prior to 2012. While there has been much touting of the strength of the consumer in recent years, it has been a credit driven mirage.
With income growth weak, debt levels elevated and rent and health care costs chipping away at disposable incomes, in order to make payments even remotely possible, terms are often stretched to 84 months. The eventual issue is that since cars are typically turned over every 3-5 years on average, borrowers are typically upside down in their vehicle when it comes time to trade it in. Between the negative equity of their trade-in, along with title, taxes, and license fees, and a hefty dealer profit rolled into the original loan, there is going to be a substantial problem down the road. [..] Auto loans, in general, have been in a huge boom that reached $1.11 trillion in the fourth quarter 2016. As noted above, 33.5% of those loans are sub-prime, or $371.85 billion.
And that’s in a country in crisis. People are scared. “Some $11.7 trillion is sitting in bank deposits, up from $7.23 trillion at the start of 2009..”
• The Fed Is Bedeviled by Keynes’s Paradox (DiMartino Booth)
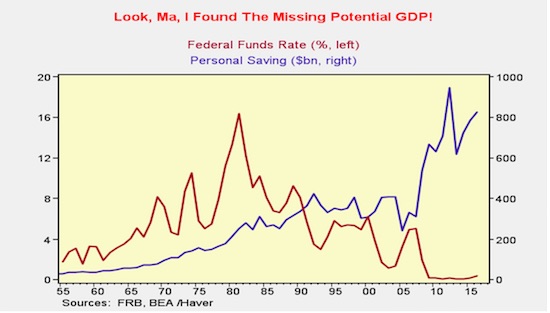
The economist John Maynard Keynes warned that ultra-low interest rates would backfire on central banks seeking to spur borrowing and spending, yet they seemed surprised that the current recovery is the weakest in postwar history after cutting rates to near zero, or even below in some cases. Keynes is credited with popularizing the “paradox of thrift,” which is the economic theory that posits people tend to save more during recessions as rates fall to offset the income their savings is not generating. Of course it is the case that when you save more, you spend less. Since the U.S. economy is fueled by consumption, it also stands to reason that growth suffers as a result.
It’s been two years since Swiss Re produced a report that calculated U.S. savers had foregone some $470 billion in interest income. The analysis was based on what rates would have been had the Federal Reserve followed the Taylor Rule, which would have put rates, then at zero, at 1.7%. Even as the Fed has begun to raise rates, it is clear that hundreds of billions of dollars have been squirreled away as savers play defense to counteract the Fed’s ultraloose monetary policy. Some $11.7 trillion is sitting in bank deposits, up from $7.23 trillion at the start of 2009 shortly after the Fed cut rates to near zero, central bank data show.
The WSJ was first, then all the media ran with it. But Flynn did NOT ask for immunity. At least not that we know. Both Nunes and Schiff deny it’s been discussed. Flyn’s lawyer doesn’t mention it. Smells like fake news. There’s so much wrong with the man, why make things up? Everyone’s salivating over potential problems he could cause for Trump, but we’ll get to that when it’s time.
• Flynn Lawyer: Client Wants Assurances Against ‘Witch-Hunt’ Prosecution (USAT)
The attorney representing President Trump’s former National Security Adviser Michael Flynn said late Thursday that his client would not submit to questioning in the ongoing investigations into Russian interference in the 2016 election without protection against possible prosecution. “No reasonable person, who has the benefit of advice from counsel, would submit to questioning in such a highly politicized, witch-hunt environment without assurances against unfair prosecution,” attorney Robert Kelner said in a written statement. Describing his client as the target of “unsubstantiated public demands by members of congress and other political critics that he be criminally investigated,” Kelner confirmed that there have been “discussions” regarding Flynn’s possible appearances before the House and Senate Intelligence committees now conducting formal inquires into Russia’s attempts to disrupt the American political system.
“Gen. Flynn certainly has a story to tell, and he very much wants to tell it, should the circumstances permit,” Kelner said. “Out of respect for the committees, we will not comment right now on the details of discussions between counsel for Gen. Flynn and the . . . committees.” Jack Langer, spokesman for the House Intelligence Committee Chairman Devin Nunes, R-Calif., said a deal for immunity has not been discussed. An aide to California Rep. Adam Schiff, the panel’s ranking Democrat, also said there had been no discussions about an immunity deal for Flynn. Earlier this week, Senate Intelligence Committee Chairman Richard Burr, R-N.C., signaled that the committee was seeking testimony from Flynn. “You would think less of us if Gen. Flynn wasn’t on that list’’ of potential witnesses, Burr told reporters Wednesday.

It’s gotten so out of hand you’d almost think it would be easy to mitigate.
• Who Gains When Income Grows? (Tcherneva)
Growth in the US increasingly brings income inequality. A striking deterioration in this trend has occurred since the 80s, when economic recoveries delivered the vast majority of income growth to the wealthiest US households. The chart illustrates that with every postwar expansion, as the economy grew, the bottom 90% of households received a smaller and smaller share of that growth. Even though their share was falling, the majority of families still captured the majority of the income growth until the 70s. Starting in the 80s, the trend reverses sharply: as the economy recovers from recessions, the lion’s share of income growth goes to the wealthiest 10% of families. Notably, the entire 2001-2007 recovery produced almost no income growth for the bottom 90% of households and, in the first years of recovery since the 2008 Great Financial Crisis, their incomes kept falling during the expansion, delivering all benefits from growth to the wealthiest 10%. A similar trend is observed when one considers the bottom 99% and top 1%% of households.
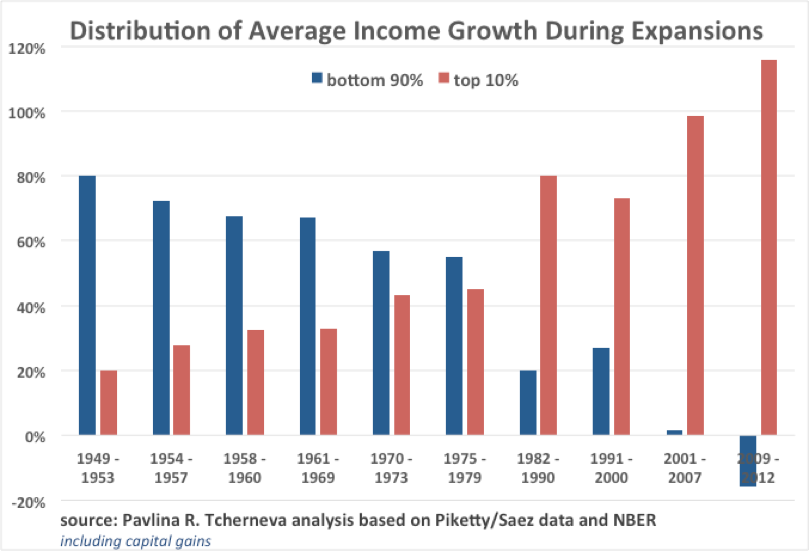
Figure 1: bottom 90% vs. top 10%, 1949-2012 expansions (incl. capital gains)
[..] Finally, Figure 6 shows how income growth has been distributed over the different business cycles (peak to peak, i.e., including both contractions and expansions). The data for the latest cycle is incomplete, as we are still in it. The graph indicates that in the current cycle, incomes for all groups are still lower than their previous peak in 2007, however the loss is disproportionately borne by the bottom 90% of households.
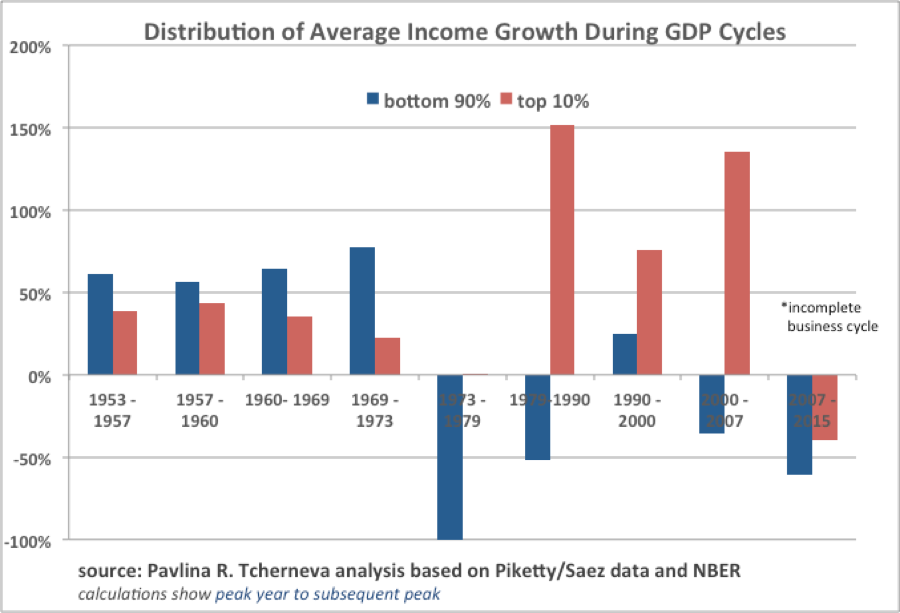
Figure 6: bottom 90% vs. top 10%, 1953-2015 business cycles, (incl. capital gains)
I made the same comparison a while back.
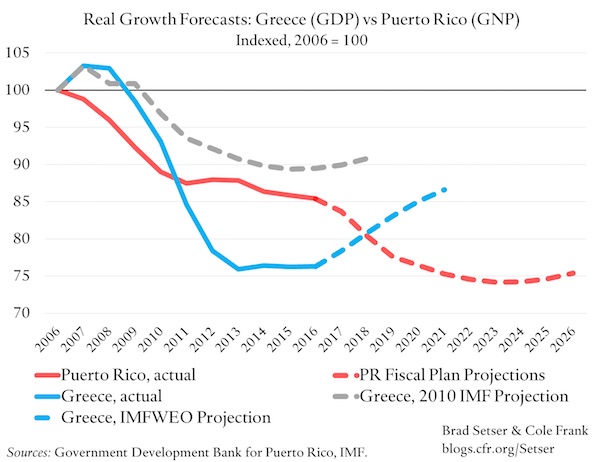
• Puerto Rico Is Starting To Look An Awful Lot Like Greece (Setser)
About two weeks ago, Puerto Rico’s oversight board approved Puerto Rico’s revised fiscal plan. The fiscal plan is roughly the equivalent in Puerto Rico’s case of an IMF program—it sets out Puerto Rico’s plan for fiscal adjustment. Hopefully it will make Puerto Rico’s finances a bit easier to understand.* I have been a bit slow to comment on the updated fiscal plan, but wanted to offer my own take:
1) Best I can tell, the new plan has roughly 2 percentage points of GNP in fiscal adjustment in 2018 and 2019, and then a percentage point a year in 2020 and 2021. The total consolidation is close to 6% of GNP (using a GNP of around $65 billion, and netting out the impact of replacing Act 154 revenues with new tax).
2) The board adopted a more conservative baseline. Puerto Rico’s real economy is projected to contract by between 3 and 4% in 2018 and 2019 and by 1 to 2% in 2020 and 2021. I applaud the board for recognizing that the large fiscal consolidation required in 2018 and 2019 will be painful. The risks to the growth baseline—and thus to future tax revenues—should be balanced. There though is a risk that the board may still be understating the drag from consolidation. If Puerto Rico is currently shrinking by 1.5% a year without any fiscal drag, and if the multiplier is 1.5, then growth might contract by 2 to 3% in 2020 or 2021.
3) While creditors have complained that Puerto Rico isn’t doing enough, I worry that there is still too much consolidation too fast: Puerto Rico’s output is projected to fall by another 10 percentage points over the next five years, which would make Puerto Rico’s ten year economic contraction as deep as that experienced by Greece.
“We have a comatose world economy held together by debt and central bank money..”
• Former Australia PM: Neo-Liberalism Has Run Into A Dead End (SMH)
Former prime minister Paul Keating – architect of some of the most profound economic reforms in the country’s history during the 1980s – has launched a surprise critique of the liberal economic philosophy he once championed, declaring it has “run into a dead end”. Mr Keating made his remarks in response to a speech delivered by the new leader of the ACTU, Sally McManus, at the National Press Club in Canberra on Wednesday. Ms McManus declared that “neo-liberalism” had run its course, and that experiments in privatisation had failed, slamming the government over mooted penalty rate cuts, accusing many employers of adopting “wage theft” as a business model, and declaring war on growing inequality.
“We are not saying that the people who introduced some of the policies that you could name as being neo-liberal were bad people, we are saying the experiment has run its course,” Ms McManus said, in response to questions. Earlier in her speech she had declared that “the Keating years created vast wealth for Australia but it has not been shared”. While many saw her remarks as a partial slapdown of the economic reforms of the Hawke/Keating years, Mr Keating told Fairfax Media he supported some of her assessments. “Liberal economics had [in the past] dramatically increased wealth around the world, as it had in Australia – for instance a 50% increase in real wages and a huge lift in personal wealth,” Mr Keating said.
“But since 2008, liberal economics has gone nowhere and to the extent that Sally McManus is saying this, she is right.” “We have a comatose world economy held together by debt and central bank money,” Mr Keating added.”Liberal economics has run into a dead end and has had no answer to the contemporary malaise.”
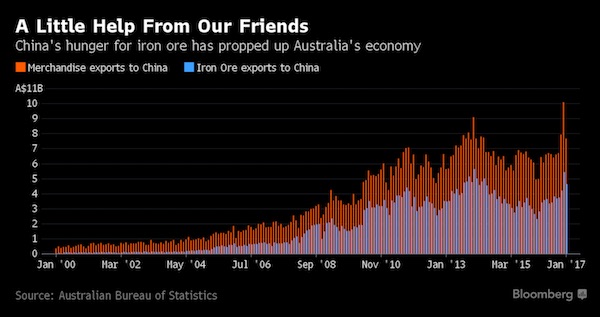
Simple story. China and private debt.
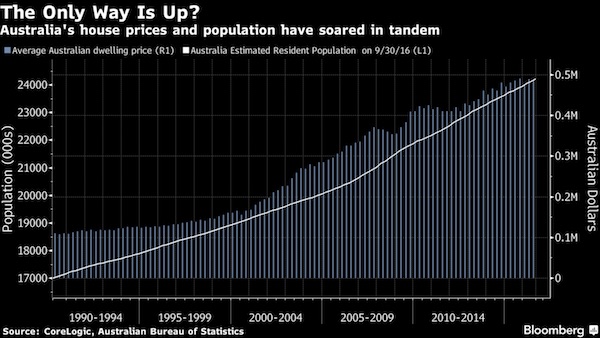
• Why Australia Hasn’t Had a Recession in Over 25 Years (BBG)
Australia is close to seizing the global crown for the longest streak of economic growth thanks to a mixture of policy guile and outrageous fortune. But the nation is creaking under the weight of its own success. While growth is being underpinned by population gains and resource exports to China, failure to spur productivity has meant stagnant living standards and electoral discontent; a property bubble fueled by record-low interest rates has driven household debt to levels that threaten financial stability; and a timid government facing political gridlock could lose the nation’s prized AAA rating as early as May because of spiraling budget deficits. Australia’s last recession – defined locally as two straight quarters of contraction – occurred in 1991 and was a devastating conclusion to eight years of reform designed to create an open, flexible and competitive economy. But it also proved cathartic, paving the way for a low-inflation, productivity-driven expansion.
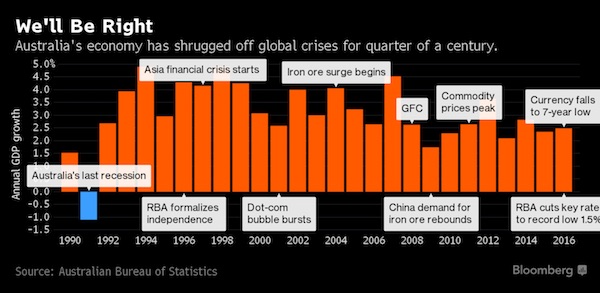
As momentum started waning, China’s re-emergence as a pre-eminent global economic power sent demand for Australian resources skyrocketing, helping shield the nation from the worst of the global financial crisis. But the post-crisis return of the boom proved ephemeral, failing to boost government coffers and pushing the local currency higher, eroding competitiveness and driving another nail into the coffin of a fading manufacturing sector. [..] “There’s no country on Earth that’s derived more benefit from the rapid growth
and industrialization of China over the last 30-odd years than Australia,” said Saul Eslake, an independent economist who’s covered Australia for over three decades. “After the end of the mining-investment boom, high immigration is helping us avoid a statistical recession, but it’s also contributing to other problems” like soaring property prices and household debt.
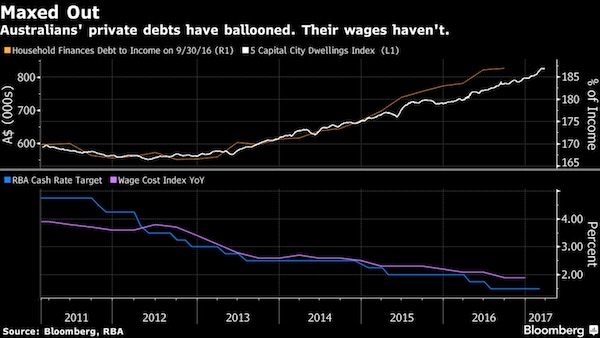
[..] A record-low 1.5% cash rate designed to steer Australia from mining investment back toward services is creating problems of its own. Sydney house prices have more than doubled since 2009 and Melbourne’s have also soared, sending private debt to a record 187% of income. The RBA frets that anemic wage growth will force heavily indebted households to slash consumption, which could prove disastrous given their spending accounts for more than half of GDP. Australia’s banking regulator further tightened lending curbs Friday to try to cool investor demand for residential property that’s helped drive up prices. Data released hours later showed investor lending increased 6.7% in February from a year earlier, the fastest growth in 12 months.
[..] iron ore prices have more than halved since 2011, when the local dollar hit a post-float record of $1.10. The Aussie would hover at or above parity with the greenback for the next two years. The currency’s strength then saw off the car industry: two of the three manufacturers in 2013 said they were quitting Australia, with the last following suit the next year. While the currency would eventually retreat to the 70s, the damage had been done. Worse still, the trillion-dollar windfall from the boom had been spent, not saved, leaving no cash to plug yawning budget deficits or build much-needed infrastructure for an expanding population that would also support growth.
Right. No crisis in 25 years.
• Why Australia Is Addicted To Interest-Only Loans (AFR)
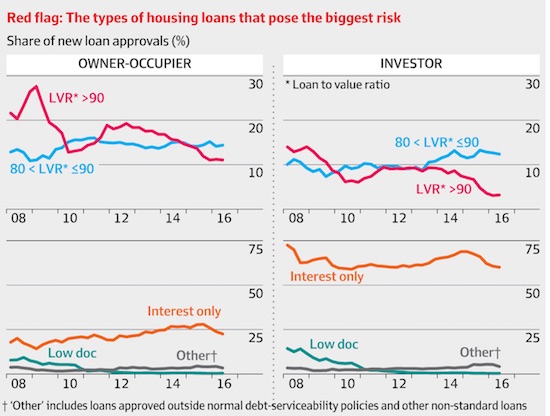
When the head of one of America’s largest real estate firms was shown a chart tracking the rising share of interest-only loans in Australia, he gasped in horror. As a man that has “seen many cycles”, he told an Australian bank investor that a rise in interest-only loans was a classic indicator of a dangerously over-heating market. Friday’s move by the prudential regulator to combat the rise of interest-only loans shows they tend to agree with that assessment. High but rising household debt levels, elevated property prices and ultra low interest rates has made Australian Prudential Regulation Authority Wayne Byres decidedly uneasy about the nation’s preference not to repay their loans but simply service the interest.
They have therefore told the banks that less than 30% of new mortgages can be “interest only” – which is substantially below the last reported figure of 38% of total loans. In fact, the percentage of interest-only loans has not been below 30% since 2008. And while many would dismiss comparisons between the rise of interest only lending in Australia and the teaser rate loans that lured in sub-prime borrowers in the US ahead of its 2008 housing crash, a market propped up by artificially low borrowing rates is a recipe for disaster. Australia is of course different and there have been unique forces that have fuelled our historic addiction to interest-only loans. The first is a hot-button issue – negative gearing. Since Australia’s tax code allows households to tax deduct interest payments on investor loans, the incentive is to opt for interest only loans.
It’s in the investment lending area where interest only loans are most prevalent. The banks are also aware that most interest only loans are to investors that own two or more properties and are managing their overall cash flows by servicing the interest. In fact, interest only loans reached a peak of 45% of new loans in 2014 before APRA’s 10% cap on investor lending was introduced. That coincided with a decline to an average of around 35%. The other driver behind the rise of interest only loans has been the mortgage broking industry – which intermediates about half of all loans by the big banks.
For once he’s joking and they take him serious. When Juncker says he’s “..going to promote the independence of Austin, Texas..”, He doesn’t mean he’s literally going to do it.
• Juncker In Jaw-Dropping Threat To Trump Over Support For Brexit (Exp.)
EU boss Jean-Claude Juncker this afternoon issued a jaw-dropping threat to the United States, saying he could campaign to break up the country in revenge for Donald Trump’s supportive comments about Brexit. In an extraordinary speech the EU Commission president said he would push for Ohio and Texas to split from the rest of America if the Republican president does not change his tune and become more supportive of the EU. The remarks are diplomatic dynamite at a time when relations between Washington and Brussels are already strained over Europe’s meagre contributions to NATO and the US leader’s open preference for dealing with national governments. They are by far the most outspoken intervention any senior EU figure has made about Mr Trump and are likely to dismay some European leaders who were hoping to seek a policy of rapprochement with their most important ally.
Speaking at the centre-right European People Party’s (EPP) annual conference in Malta this afternoon, the EU Commission boss did not hold back in his disdain for the White House chief’s eurosceptic views. He said: “Brexit isn’t the end. A lot of people would like it that way, even people on another continent where the newly elected US President was happy that the Brexit was taking place and has asked other countries to do the same. “If he goes on like that I am going to promote the independence of Ohio and Austin, Texas in the US.” Mr Juncker’s comments did not appear to be made in jest and were delivered in a serious tone, although one journalist did report some “chuckles” in the audience and hinted the EU boss may have been joking. The remarks came in the middle of an angry speech in which the top eurocrat railed widely against critics of the EU Commission.
[..] Mr Juncker did not criticise Britain at all during his speech, and only made reference to Brexit in relation to Mr Trump and the opportunities it presents for Europe to reform itself. However his conservative colleague Antonio Tajani, the EU Parliament president, received a rapturous ovation as he launched an impassioned defence of Europe’s “Christian values”. In a series of thinly veiled comments about immigration, a major political issue in his homeland and Malta, the Italian official said Europe should do more to defend its historic identity. He said: “We shouldn’t be ashamed of saying we’re Christian. We’re Christian, it is our history. “If we leave our identity we will have in Europe all identities but not European identities. For this we need to strengthen our identity.”
Support Steve at Patreon.
• The European Central Bank Doesn’t Understand The Economy (Steve Keen)
In 1992, Wynne Godley predicted that the Euro would amplify any future economic downturn into a crisis: ” If a country or region has no power to devalue, and if it is not the beneficiary of a system of fiscal equalisation, then there is nothing to stop it suffering a process of cumulative and terminal decline leading, in the end, to emigration as the only alternative to poverty or starvation…”
It’s inconvenient with the threat of elections and Beppe Grillo surging in the polls. And even without Beppe Italy is a huge threat to the EU economy.
• Why Italy’s Banking Crisis Has Gone Off the Radar (DQ)
[..] an article published in the financial section of Italian daily Il Sole lays out just how serious the situation has become. According to new research by Italian investment bank Mediobanca, 114 of the close to 500 banks in Italy have “Texas Ratios” of over 100%. The Texas Ratio, or TR, is calculated by dividing the total value of a bank’s non-performing loans by its tangible book value plus reserves – or as American money manager Steve Eisman put it, “all the bad stuff divided by the money you have to pay for all the bad stuff.” If the TR is over 100%, the bank doesn’t have enough money “pay for all the bad stuff.” Hence, banks tend to fail when the ratio surpasses 100%. In Italy there are 114 of them. Of them, 24 have ratios of over 200%.
Granted, many of the banks in question are small local or regional savings banks with tens or hundreds of millions of euros in assets. These are not systemically important institutions and can be resolved without causing disturbances to the broader system. But the list also includes many of Italy’s biggest banks which certainly are systemically important to Italy, some of which have Texas Ratios of over 200%. Top of the list, predictably, is Monte dei Paschi di Siena, with €169 billion in assets and a TR of 269%. Next up is Veneto Banca, with €33 billion in assets and a TR of 239%. This is the bank that, together with Banco Popolare di Vicenza (assets: €39 billion, TR: 210%), was supposed to have been saved last year by an intervention from government-sponsored, privately funded bank bailout fund Atlante, but which now urgently requires more public funds. Their combined assets place them seventh on the list of Italy’s largest banks.
Some experts, including the U.S. bank hired last year to save MPS, JP Morgan Chase, have warned that Popolare di Vicenza and Veneto Banca will not be eligible for a bailout since they are not regarded as systemically important enough. This prompted investors to remove funds from the banks, further exacerbating their financial woes. According to sources in Rome, the two banks’ failure would send shock waves through the wider Italian financial industry. [..] almost all of Italy’s largest banking groups, with the exception of Unicredit, Intesa Sao Paolo and Mediobanca itself, have Texas Ratios well in excess of 100%. But, as Eisman recently pointed out, the two largest banks, Unicredit and Intesa Sanpaolo, have TRs of over 90%. As long as the other banks continue to languish in their current zombified state, they will continue to drag down the two bigger banks. And if either Unicredit or Intesa begin to wobble, the bets are off.
“Land-based species are moving polewards by an average of 17km per decade, and marine species by 72km per decade..”
• Global Reshuffle Of Wildlife Will Have Huge Impacts On Humanity (G.)
Rising temperatures on land and sea are increasingly forcing species to migrate to cooler climes, pushing disease-carrying insects into new areas, moving the pests that attack crops and shifting the pollinators that fertilise many of them, an international team of scientists has said. They warn that some movements will damage important industries, such as forestry and tourism, and that tensions are emerging between nations over shifting natural resources, such as fish stocks. The mass migration of species now underway around the planet can also amplify climate change as, for example, darker vegetation grows to replace sun-reflecting snow fields in the Arctic. “Human survival, for urban and rural communities, depends on other life on Earth,” the experts write in their analysis published in the journal Science. “Climate change is impelling a universal redistribution of life on Earth.”
This mass movement of species is the biggest for about 25,000 years, the peak of the last ice age, say the scientists, who represent more than 40 institutions around the world. [..] “Land-based species are moving polewards by an average of 17km per decade, and marine species by 72km per decade” said Prof Gretta Pecl at the University of Tasmania in Australia, who led the new analysis. There are many documented examples of individual species migrating in response to global warming and some examples of extinctions. But Pecl said: “Our study demonstrates how these changes are affecting ecosystems, human health and culture in the process.” The most direct impact on humans is the movement of insects that carry diseases, such as the mosquitoes that transmit malaria shifting to new areas as they warm and where people may have little immunity.
Another example is the northward spread in Europe and North America of the animal ticks that spread Lyme disease: the UK has seen a tenfold rise in cases since 2001 as winters become milder. Food production is also being affected as crops have to be moved to cooler areas to survive, such as coffee, which will need to be grown at higher, cooler altitudes, causing deep disruption to a global industry. The pests of crops will also move, as will their natural predators, such as insects, birds, frogs and mammals. Other resources are being affected, with a third of the land used for forestry in Europe set to become unuseable for valuable timber trees in the coming decades. Important fish stocks are migrating towards the poles in search of cooler waters, with the mackerel caught in Iceland jumping from 1,700 tonnes in 2006 to 120,000 tonnes in 2010…
Another ‘species’ on the move.
• More Than 5 Million Syrian Refugees In Neighbouring Countries Now (G.)
The number of refugees who have fled Syria for neighbouring countries has topped five million people for the first time since the civil war began six years ago, according to the UN’s refugee agency. Half of Syria’s 22 million population has been uprooted by a conflict that has now lasted longer than the second world war, the figures released by the UNHCR show, with 6.3 million people who are still inside the country’s borders forced from their homes. The figure of five million refugees “fails to account for the 1.2 million people seeking safety in Europe”, the International Rescue Committee, an aid organisation, noted. Nearly 270,000 of these applied for asylum in Germany last year. The UN agency urged Europeans not to “put humanity on a ballot” in elections in France and Germany this year, where far-right candidates opposed to refugee arrivals could make gains.
A surge in violence in Aleppo, as government forces backed by Russian airstrikes retook Syria’s second city at the end of 2016, resulted in 47,000 people fleeing to neighbouring Turkey, it said. Camps for internally displaced people close to the Turkish border also hold those who have fled the fighting in northern Syria. The latest arrivals into Turkey mean the number of Syrians who have fled the country for neighbouring states stands at more than five million, four years after the UNHCR announced that one million people had fled. The five million figure includes refugees who have been resettled in Europe, but the UN high commissioner for refugees urged Europeans to do more to help share a burden that is still largely falling on countries bordering Syria, such as Turkey, Lebanon and Jordan, with more in Iraq and Egypt.
Turkey alone has nearly three million Syrians, the UNHCR pointed out. In Jordan, 657,000 Syrian refugees are registered with the UN, but the government says the true figure is 1.3 million. Tens of thousands of Syrians live in two large camps, Zaatari and Azraq, but the majority live in homes and flats, able to access the job market but competing for scarce employment.
Home › Forums › Debt Rattle March 31 2017