

Sandro Botticelli Portrait of a Young Woman 1480 – 1485

The St. Louis Fed says yes.
• Can an Inverted Yield Curve CAUSE a Recession? (St. Louis Fed)
An inverted yield curve—or a situation in which market yields on shorter-term U.S. Treasury securities exceed those on longer-term securities—has been a remarkably consistent predictor of economic recessions. However, simply because inversions forecast recessions does not necessarily mean that inversions cause recessions. Why might a yield curve inversion cause economic activity to slow?
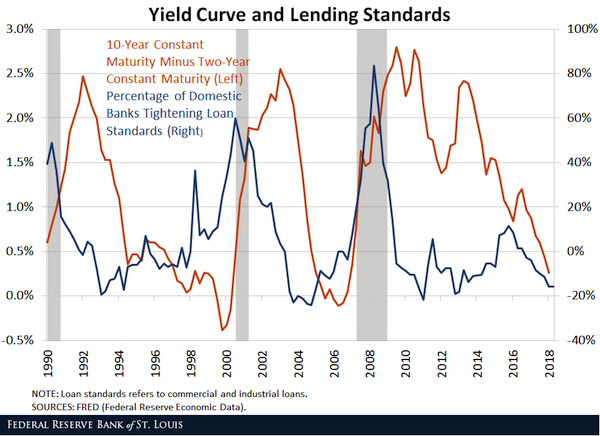
Recently, the Federal Reserve asked banks how their lending policies might change in response to a hypothetical moderate inversion of the yield curve.1 Many of those surveyed indicated that they would tighten lending standards or price terms on every major loan category. When asked why they would do so, several potential reasons were given: • An inversion could cause loans to be less profitable relative to the bank’s cost of funds. • An inversion would cause their banks to be less risk tolerant. • An inversion may signal a less favorable or more uncertain economic outlook. The figure below illustrates the tendency of banks to tighten lending terms when the yield curve inverts. It plots the yield on 10-year Treasury securities minus the yield on two-year securities.
Normally, the yield on 10-year securities exceeds the yield on two-year securities, reflecting the fact that the yield curve is usually upward sloping. The yield curve is downward sloping (or inverted) when the yields on shorter-term securities are higher than those on longer-term securities, as in 2000 and 2006. Both of those inversions were followed by the start of a recession within a few months. The Fed has surveyed banks on their lending terms continuously since 1990. The chart shows that the net percentage of banks tightening their lending standards on commercial and industrial loans began to rise around the time that the yield curve inverted in 2000 and 2006.
Why is this important? Researchers have found that the economy tends to slow after banks tighten their lending standards, suggesting that an inversion of the yield curve could cause economic activity to slow by leading banks to reduce the supply of loans. Thus, an inverted yield curve might do more than predict a recession: It might actually cause one.
“..like a massage price that suggests you’re probably getting more than a massage.”
• The Malaysia Scandal Is Starting to Look Dire for Goldman Sachs (Taibbi)
Goldman Sachs, which has survived and thrived despite countless scandals over the years, may have finally stepped in a pile of trouble too deep to escape. There’s even a Donald Trump angle to this latest great financial mess, but the outlines of that subplot – in a case that has countless – remains vague. The bank itself is in the most immediate danger. The company’s stock rallied Thursday to close at 165, stopping a five-day slide in which the firm lost almost 12 percent of its market value. The company is down 35 percent for the year, most of that coming in the past three months as Goldman has been battered by headlines about the infamous 1MDB scandal.
Just before Christmas, Malaysian authorities filed criminal charges against Goldman, seeking a stunning $7.5 billion in reparations for the bank’s role in the scandal. Singapore authorities also announced they were expanding their own 1MDB probe to include Goldman. In the 1MDB scheme, actors tied to former Malaysian Prime Minister Najib Razak allegedly siphoned mountains of cash out of a state investment fund. The misrouted money went to lavish parties with celebrity guests like Alicia Keys, a $35 million jet, works by Monet and Van Gogh, property in New York, Los Angeles and London, and (ironically) the funding of the movie The Wolf of Wall Street.
The cash for this mother of all bacchanals originally came from bonds issued by Goldman, which earned a whopping $600 million from the Malaysians. The bank charged prices for its bond issuance that analysts believe were suspiciously high – like a massage price that suggests you’re probably getting more than a massage.
Not crazy, but the new normal. Because no market.
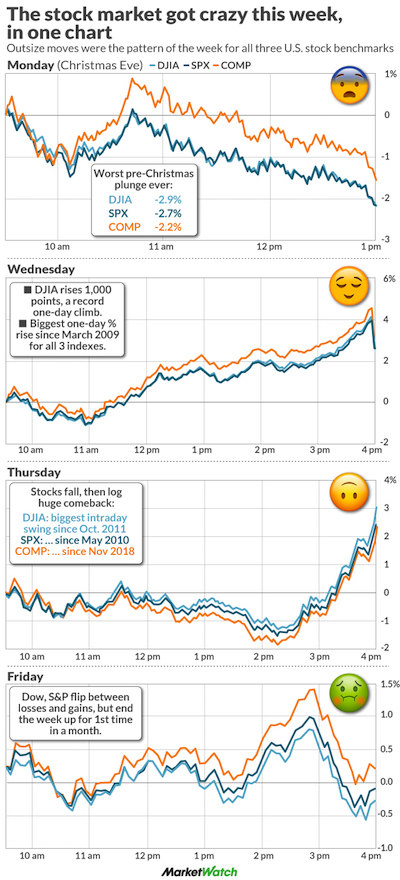
• How Crazy This Week Was For The Stock Market, In One Big Chart (MW)
This Christmas week really was one for the history books. Whiplash, anyone? On Monday, the Dow Jones Industrial, the S&P 500 and the Nasdaq all booked their ugliest-ever plunges in the shortened Christmas Eve trading session. All three indexes rebounded Wednesday, only to sink early Thursday and then turn around in dramatic fashion to finish the session higher. The week finished Friday with an indecisive whimper, as stocks flipped back and forth between gains and losses all day long. The week’s sharp moves were attributed mostly to light holiday trading volume and computer-driven trading. But the ups and downs during a usually calm period are no doubt stoking investor anxiety about what’s to come.
“..loan funds [must] hold considerable amounts of cash so that they can meet redemptions.”
Leveraged loans and considerable amounts of cash. That don’t rhyme.
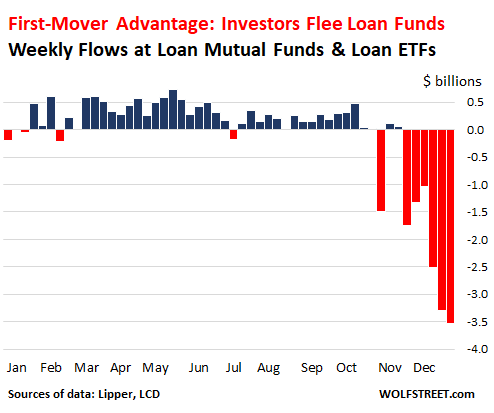
• Record-Bad Year-End For $1.3-Trillion “Leveraged Loan” Market (WS)
Part of the $1.3 trillion in “leveraged loans” — loans issued by junk-rated overleveraged companies — end up in loan mutual funds and loan ETFs. These funds saw another record outflow in the week ended December 26: $3.53 billion, according to Lipper. It was the sixth outflow in a row, another record. Over the past nine weeks, $14.8 billion had been yanked out, another record. These outflows are, as LCD, a unit of S&P Global Market Intelligence, put it, “punctuating a staggering turnaround for the asset class” that until October was red-hot. Despite $10 billion of net inflows during 2018 through early October, the record outflows at the end of the year caused a net outflow for the entire year of $3.1 billion. What a sudden turnaround!
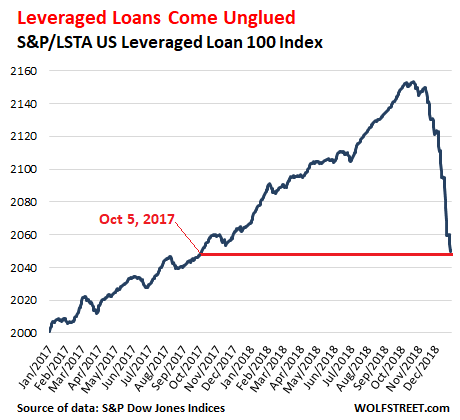
It can take a long time to sell a leveraged loan. Each is a unique contract, and finding a buyer and agreeing on a price and completing the sale takes time. So loan funds hold considerable amounts of cash so that they can meet redemptions. But now, loan funds faced with this onslaught of redemptions have to dump loans in order to stay ahead of the redemptions and maintain a cash cushion. This forced selling by loan funds has caused prices to drop – which is further motivating investors to yank even more out of those loan funds. Since October 22, the S&P/LSTA US Leveraged Loan 100 Index, which tracks the prices of the largest leveraged loans, has dropped 4.8%. This price decline put the index back where it had been on October 5, 2017. But note, while there have been some defaults recently, the big wave of defaults that many expect in an environment where credit is tightening for risky corporate borrowers, hasn’t even started yet. These are still the good times:
“..Christmas-to-Christmas growth in the federal debt equals approximately $4,178.10 per average US citizen..”
• US Debt Soars $1.4 Trillion From Last Christmas, $44,000 Per Second (RT)
The year-on-year surge in US sovereign debt has totaled $1.37 trillion, the latest data released by the US Treasury Department shows. The national debt reportedly rose to $21,863,635,176,724.12 as of December 20 of the current year compared to $20,492,874,492,282.58 on December 25, 2017. The current US population stands at 328,082,386 according to the December statistics produced by the Census Bureau, a unit of the US Department of Commerce. Rough calculations show that Christmas-to-Christmas growth in the federal debt equals approximately $4,178.10 per average US citizen.
According to Census Bureau estimates, there were 127,586,000 households in the country in 2018, which means that an average American family owes some $10,743.82. Moreover, since the end of the last fiscal year through December 20, the federal government added some $340 billion to the country’s sovereign debt. That means the debt had been skyrocketing at around $3.8 billion per day, or nearly $44,000 per second. US debt is expected to hit $22 trillion in the near future and the ongoing government spending will drive the debt to $33 trillion within a decade.
Remeber: this is what the economy runs on. This is how money enters that economy.
• US Home Sales Decline To Steepen, No Respite In Sight. (WS)
Pending home sales is a forward-looking measure. It counts how many contracts were signed, rather than how many sales actually closed that month. There can be a lag of about a month or two between signing the contract and closing the sale. This morning, the National Association of Realtors (NAR) released its Pending Home Sales Index for November, an indication of the direction of actual sales to be reported for December and January. This index for November fell to the lowest level since May 2014:
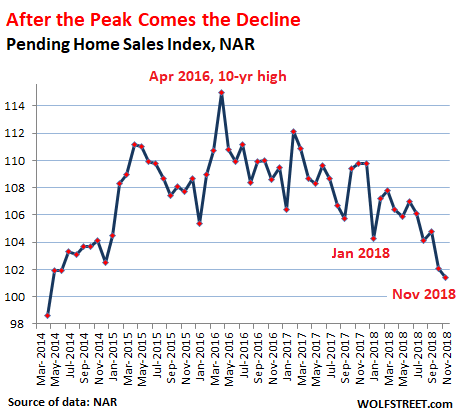
“There is no reason to be concerned,” the report said, reassuringly. And it predicted “solid growth potential for the long-term.” And the index plunged 7.7% compared to November last year, the biggest year-over-year percentage drop since June 2014. The drops in October and November are indicated in red:
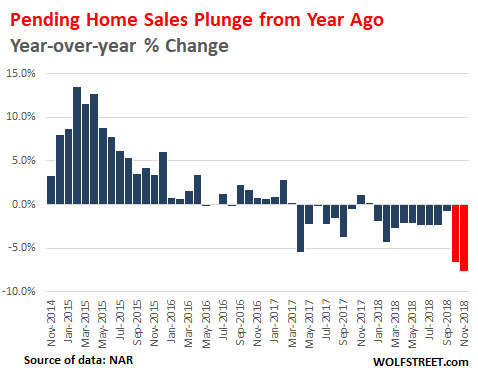
All four regions got whacked by year-over-year declines: • Northeast : -3.5% • Midwest: -7.0% • South: -7.4% • West: -12.2%. The plunge in pending home sales in the West, a vast and diverse region, will prolong the plunge in closed sales for the region. Particularly on the West Coast, the largest and very expensive markets — Seattle metro, Portland metro, Bay Area, and Los Angeles area — have been experiencing sharp sales declines, a surge in inventory for sale, and starting this summer, declining prices. Today’s pending home sales data confirms that these trends are intact and will likely continue.
The NAR report blames the sales decline in the expensive markets in the West on “affordability challenges” – because prices “have risen too much, too fast,” it said. And this is a true and huge problem: Home prices have shot up for years, even while wages ticked up at much slower rates. At some point, the market is going to run out of people with median incomes who are willing to stretch to the limit to buy a starter shack; and the market is going to run out of people with high incomes who are willing to stretch to the limit to buy a median house.
“..economies don’t de-grow, at least not in an orderly way.”
• Which Side Are You On? (Jim Kunstler)
The true rebalancing of pension funds, and everything else in American life, will come with the recognition that we are tapped out and bumping up against actual limits. Alas, economies don’t de-grow, at least not in an orderly way. They reach a certain complete efflorescence and then they wilt, or collapse. Survival becomes a matter of how human beings adapt to new conditions. Attempts at mitigation — propping up the status quo — add up to a mug’s game, whether it’s stock markets, agri-biz, political parties, weather systems, or influence over people in distant lands.
The argument will come down to the Mitigationists versus the Adapters. The problem for the Mitigators is that most of what they can do is based on pretending: e.g. that some energy miracle is at hand… that we’ll soon be mining asteroids… that we’ll build dikes around Miami Beach… that Modern Monetary Theory (the “science” of getting something for nothing) can negate the physical laws of the universe. The Mitigationists will be disappointed as they “consume” their last images of iPhone porn, waiting for Elon Musk to save the world.
The Adapters will be out there working with the changes that reality serves up, probably with hand tools. There may be a lot fewer of them, living in a more austere everyday economy, but they will remain onstage when the Mitigationists depart this earth in tears for a mysterious realm that turns out not to be a golf course subdivision on Mars with a Tesla in every driveway. Something’s coming and the wild algo instability in the markets is yet another sign that anybody can read. Even if it quiets down for a few weeks in early 2019, as I think it may, the fireworks are only beginning. Which side are you on?
Maybe not in practice, though.
• Universal Basic Income Is Easier Than It Looks (Ellen Brown)
Calls for a Universal Basic Income have been increasing, most recently as part of the Green New Deal introduced by Rep. Alexandria Ocasio-Cortez (D-NY) and supported in the last month by at least 40 members of Congress. A Universal Basic Income (UBI) is a monthly payment to all adults with no strings attached, similar to Social Security. Critics say the Green New Deal asks too much of the rich and upper-middle-class taxpayers who will have to pay for it, but taxing the rich is not what the resolution proposes. It says funding would primarily come from the federal government, “using a combination of the Federal Reserve, a new public bank or system of regional and specialized public banks,” and other vehicles.
The Federal Reserve alone could do the job. It could buy “Green” federal bonds with money created on its balance sheet, just as the Fed funded the purchase of $3.7 trillion in bonds in its “quantitative easing” program to save the banks. The Treasury could also do it. The Treasury has the constitutional power to issue coins in any denomination, even trillion dollar coins. What prevents legislators from pursuing those options is the fear of hyperinflation from excess “demand” (spendable income) driving prices up. But in fact the consumer economy is chronically short of spendable income, due to the way money enters the consumer economy. We actually need regular injections of money to avoid a “balance sheet recession” and allow for growth, and a UBI is one way to do it.
The pros and cons of a UBI are hotly debated and have been discussed elsewhere. The point here is to show that it could actually be funded year after year without driving up taxes or prices. New money is continually being added to the money supply, but it is added as debt created privately by banks. (How banks rather than the government create most of the money supply today is explained on the Bank of England website) A UBI would replace money-created-as-debt with debt-free money – a “debt jubilee” for consumers – while leaving the money supply for the most part unchanged; and to the extent that new money was added, it could help create the demand needed to fill the gap between actual and potential productivity.
This is a nice effort from Tom Coburg for the Canary, and very much in line with some of the things I’ve said. But he misses an enormous elephant, and it’s hard to see how. See, he cites a May 18 2018 article by Luke Harding, Dan Collyns and Stephanie Kirchgaessner as the instant when the Guardian campaign against Assange started. But just three days prior to that, on May 15, the same authors posted 3 articles about Assange and his relations with Ecuador that are pure smear and very much part of the campaign against Assange. I linked to these things in my May 16 article, “I Am Julian Assange”
• Guilty By Innuendo: The Guardian Campaign Against Julian Assange (Canary)
An analysis of articles published by the Guardian over several months reveals what appears to be a campaign to link WikiLeaks founder Julian Assange with Russia and the Kremlin. But the paper has provided little or no evidence to back up the assertions. And amid recent revelations that Guardian journalists have associated with the psychological operations experts at the Integrity Initiative, we should perhaps be more sceptical than ever before. This particular campaign by the Guardian appears to have begun with an article on 18 May 2018 from Luke Harding, Dan Collyns and Stephanie Kirchgaessner.
It stated that “Assange has a longstanding relationship with RT”, the Russian TV broadcaster; and the headline was Assange’s guest list: the RT reporters, hackers and film-makers who visited embassy. Assange has had hundreds of people visit him at the embassy, but the article was keen to focus on the “senior staff members from RT, the Moscow TV network described by US intelligence agencies as the Kremlin’s ‘principal international propaganda outlet’”. On the same day, the Guardian published another article, claiming that Assange had visits from “individuals linked to the Kremlin”, but which offered no evidence for this.