
Phillip Harrington Elvis in his Messerschmitt “bubble car”, with grandfather Jessie Presley 1956
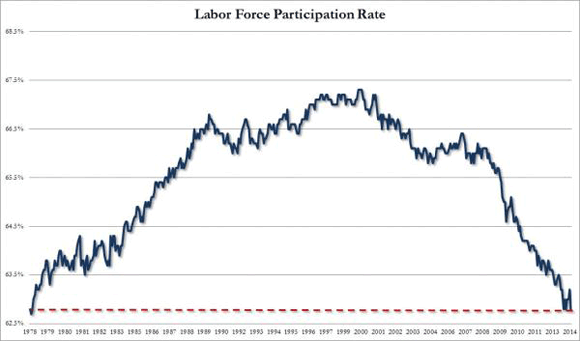
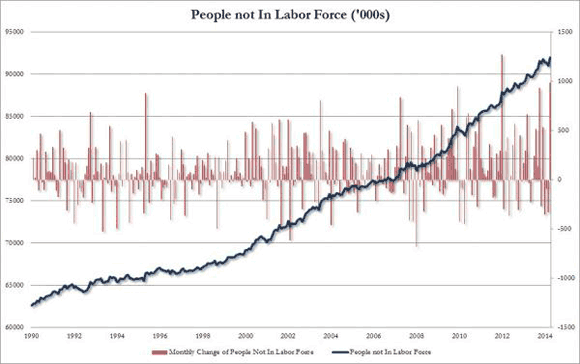
More curious numbers every day. An increase of 288,000 jobs in the BLS report’s Establishment Survey, but a decline of 73,000 jobs in the Household Survey; an additional 988,000 Americans left the labor force for an all time high of 92 million not in the labor force, as the Labor Participation Rate moved towards lowest since January 1978 and the Birth/Death model added 234,000 jobs. This is where I think: you tell me.
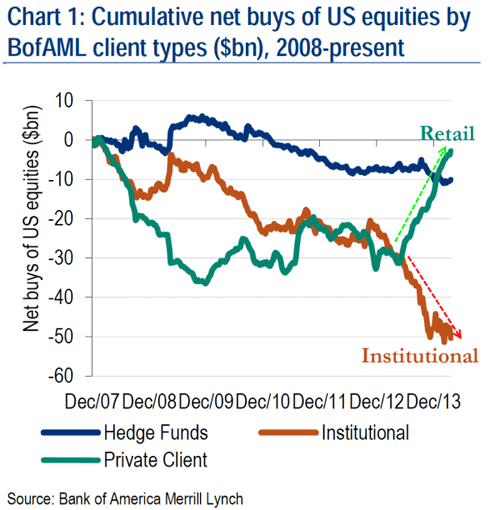
Most interesting graph of the day must be the Bank of America one Tyler Durden posted, which shows where the smart money parted ways with the mom and pop greatest fools.
That takes me to a Jeremy Grantham note Durden also posted, in which Grantham describes how he and his people at GMO have tried to define bubbles to figure out when this one will burst. His preliminary conclusion is, with a lot of caveats, and I’m oversimplifying, that he would expect a run up in the S&P all the way to 2250 or higher before the crash, which he sees happening around the time of the next US presidential elections, in 2016.
- … this year should continue to be difficult with the February 1 to October 1 period being just as likely to be down as up, perhaps a little more so.
- But after October 1, the market is likely to be strong, especially through April and by then or in the following 18 months up to the next election (or, horrible possibility, even longer) will have rallied past 2,250, perhaps by a decent margin.
- And then around the election or soon after, the market bubble will burst, as bubbles always do, and will revert to its trend value, around half of its peak or worse, depending on what new ammunition the Fed can dig up.
Looking at that, I’m wondering about the double trend in that graph above: how much longer will mom and pop keep buying in the face of the smart money leaving, and how much more can the smart money sell? Does that look like a trend that can last another 30 months? What about UK housing prices, can they rise 30 more months? Does Grantham think Japan will last another 30 months, given that Abenomics looks like a sure failure, despite the ‘great’ March sales numbers which were due only to that April 1 tax hike? What does he think of China, where, no matter how much numbers may contradict each other, it looks hard to deny matters have hit a serious snag?
I’m wondering if models like Grantham’s maybe look too much and too exclusively at American markets through history, and pay too little attention to the fact that the – potential – influence of other markets has increased to higher levels than seen in at least a long time. Is that what we see when he posits the 2016 US elections as a possible turning point? That his theories are based on too much all US all the time, perhaps because the advent of Asian and other emerging markets has no precedent in history over the past 100 years?
I know that bubble collapses are impossible to pinpoint, and I know that Grantham comes with all the caveats he builds into his notes, and that it’s hard to foresee which central banks will come with which next round of bankers’ wives and children first, but then again, Grantham does post this graph from John Hussman, and he does write this comment:
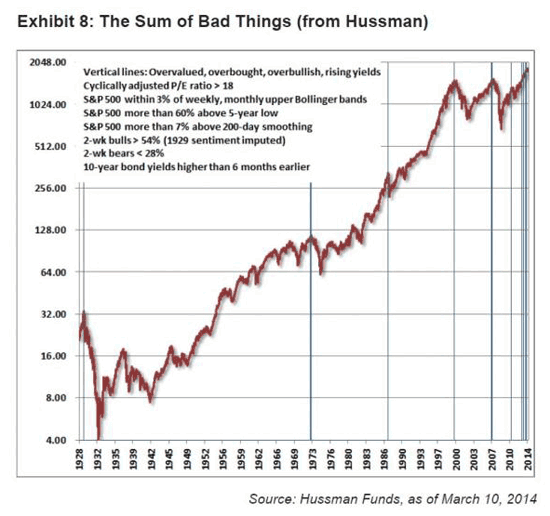
Exhibit 8 shows an equally disturbing Hussman exhibit in which he has collated very bad things that happen to markets. His exhibit suggests that whenever this large collection of troublesome predictions line up like they have recently there has been a very serious and fairly immediate market decline. While I have no quarrel with the eventual outcome and recognize that possibly the bear market’s time may have come, particularly in light of recent market declines (April 13, 2014), I still think it’s less likely than my suggestion of a substantial and quite lengthy last hurrah.
Hussman’s graph, as is obvious, is based on US markets as much as Grantham’s thoughts are. Perhaps that is simply too limited in today’s world. Because I don’t think anyone could argue that either China or Japan, or Europe, would NOT be able to sink the S&P. Whereas 50 years ago, that would have looked entirely different.
Anyway, that struck me in what Grantham writes. Not that it’s impossible that a real big crash, of which he’s as sure as I am by the way, will take 30 more months to materialize, but I see too many risk factors around the globe that could sink the S&P, to agree with his analysis. For instance, I think the Fed may feel it can continue to taper because it’s found a way to transfer the negative effects to emerging markets (I’m sure that’s a major consideration), but a major shock in some of those markets may backfire and take enough air out of Wall Street to cause serious damage there.
All that remains in today’s financial systems is a paperthin layer of trust, in the Fed, the S&P, the government, and that’s true for many countries, with their own central banks etc. In the present time, those risks no longer simple add up, they get multiplied into a kind of exponential function. And that’s new, historical models don’t capture that. It’s new to the extent that analyzing only the S&P’s history may well be woefully insufficient. Global financial markets have developed a cross-breeding incestuous relationship that’s a sort of an all for one and one for all, in which they all rise together and get swallowed up by a sinkhole together. And the more QE is applied across global central banks, one after the other, the deeper that hole becomes, in an exponential fashion. I think that needs to be part of any US market analysis.


• Payrolls in U.S. Rise Most Since 2012, Unemployment at 6.3% (Bloomberg)
Employers boosted payrolls in April by the most in two years and the jobless rate plunged to 6.3% as companies grew confident the U.S. economy was emerging from a first-quarter slowdown. The 288,000 gain in employment was the biggest since January 2012 and followed a revised 203,000 increase the prior month, Labor Department figures showed today in Washington. The median forecast in a Bloomberg survey of economists called for a 218,000 advance. Unemployment dropped to the lowest level since September 2008.
One cloud in today’s employment report is worker pay is stagnating. Average hourly earnings held at $24.31 in April, and were up 1.9% over the past 12 months, the smallest gain this year. The drop in the unemployment rate from March’s 6.7% came as the agency’s survey of households showed the labor force shrank by more than 800,000 in April. The so-called participation rate, which indicates the share of working-age people in the labor force, decreased to 62.8%, matching the lowest level since 1978, from 63.2% a month earlier.
Read more …
• 1 Million People Drop Out Of Labor Force; Participation Rate Lowest Since 1978 (Zero Hedge)
And so the BLS is back to its old data fudging, because while the Establishment Survey job number was a whopper, and the biggest monthly addition since January 2012, the Household Survey showed an actual decline of 73K jobs. What is much worse, is that the reason the unemployment rate tumbled is well-known: it was entirely due to the number of Americans dropping out of the labor force. To wit, the labor force participation rate crashed from 63.2% to 62.8%, trying for lowest since January 1978! And why did it crash so much – because the number of people not in the labor force soared to 92 million, the second highest monthly increase ever, or 988K, only ‘better’ than January 2012 which curiously was the one month when the establishment survey reported a 360K “increase” in jobs.
End result: the number out of the labor force is now an all time high 92 million, and the labor force tumbled by 800K to 155.4 million from 156.2 million as the delayed effect of the extended jobless benefits ending finally hits. What is most amusing is that the “persons who currently want a job” was unchanged at 6,146K – even the BLS said it was “puzzled why so many unemployed people are not looking for jobs.” We have some ideas, and no, they don’t include the addition of 234K “birth/death adjustment” jobs.
Read more …
Gambling.
• Speculative Fever Is Back To 2008, With Compound Interest (AEP)
We are in a colossal bubble once again. It is worse than 2008 on many indicators, though the epicentre of risk is ever more concentrated in sovereign debt, especially the debt of those countries without a central bank (you all know who I mean). Today’s chart from Andrew Lapthorne as Societe Generale is remarkable. It tracks the nominal yield on a classic mix of different assets held by funds. The return on SG’s Quality Index is close to an all-time low of 2.4% (though this of course pick up pre-deflation fears, as well as speculative mania). He says there has been a rotation out of momentum stocks – ie, the US tech sector – and into value stocks and those with high dividend yield. That is not as comforting as it sounds.
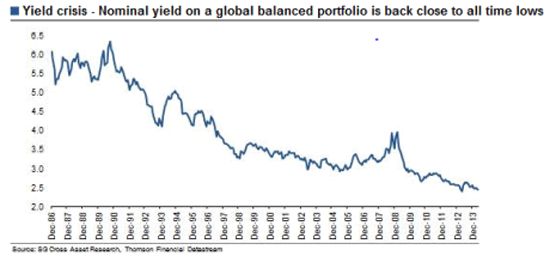
“Is this yield and value-orientated positioning reflecting a more cautious outlook? So far we doubt it. April also saw the largest junk bond issue of all time, and corporates continue to issue large quantities of debt at incredibly low yields. So despite the US Federal Reserve continuing to taper and the back up in US bond yields … the yield on a global asset portfolio is close to where it was this time last year.” It was a similar message in Neil Mellor’s morning note from Bank of New York Mellon. The euro sovereign markets have gone mad. (Note that Irish 10-year yields are nearing US Treasury yields – the global benchmark price of money – and Spain is not far behind). Borrowing costs are back to 2008 levels, yet the debt burdens are massively higher, and still rising.
As Mr Mellor reminds us, Germany has shot down any prospect of an EMU fiscal union, and the Draghi backstop plan for Italian and Spanish debt (OMT) has been declared a treaty violation and probably ultra vires by the German constitutional court. The deflationary/lowflation climate is eroding the debt dynamics of the Club Med bloc. “Japan has managed a similar scenario over the years but only with the active connivance of the Bank of Japan and its acquiescence to debt monetisation – something that is worlds away in the euro-area,” he said. “All considered, it is difficult not to conclude that the euro-area debt markets are therefore in the grip of speculative forces – forces that convey progress and confidence, but belie an underlying economy that is only just getting to its feet after four years of penury.
“Greece is the euro-area microcosm: its growth remains anaemic, its unemployment queues long with a generation of youth part structurally disengaged, and with debt of 175% of GDP and rising, it is far from clear whether the country can pay its way and avoid further assistance: but despite these profound uncertainties, its government recently returned to the market and despite numerous defaults in recent years, saw its allocation of five year bonds oversubscribed to the tune of 7-1 despite offering a return of less than 5%. If nothing else this surely speaks volumes about the forces permeating markets in 2014.”
Read more …
This is from the Telegraph of all places. COuld we ask Cameron to make it rhyme with that great recovery story he’s peddling?
• UK Suffers ‘Unprecedented’ Fall In Real Wages (Telegraph)
British workers have suffered an “unprecedented” decline in real wages over the past six years, with the average employee £2,000 worse off since the financial crisis hit, according to new research. The average worker saw a 8% decline in real wages between 2008 and 2013, said the National Institute of Economic and Social Research (NIESR). “The scale of the real wage falls is historically unprecedented, certainly in the past 50 years where broadly comparable records exist,” said Paul Gregg, Stephen Machin and Mariña Fernández Salgado, the authors of the report. Official data this month showed that workers experienced a 7.6% fall in real wages over the past six years. However, the research published by NIESR revealed that young workers, among the hardest hit by the downturn, also saw the biggest decline over the period, with pay falling by 14% between 2008 and 2013.
“For workers aged between 18 and 25, the fall in real wages in the recent period has been so extreme that, in real terms, wages are back to levels not seen since 1998,” the authors said. They noted that part of this was caused by shifts in part-time working, which could be linked to more people entering higher education. However, it noted that the fall in the 25 to 29-year-old age group was also substantial. Real pay among these workers fell by 12%, taking wage levels back to where they were in 1999. While the authors said recent falls in the unemployment rate were likely to be accompanied by stronger wage growth, they calculated that meaningful increases were unlikely to materialise until later this year, with the biggest effects not seen until 2016.
Read more …
• The Great(est Fool) Rotation: Who’s Buying, And Who’s Selling? (Zero Hedge)
We could yarn on for hundreds of words discussing the ins and outs of falling volumes and record-er highs in US equity markets as Treasury bond yields collapse, macro- and micro-fundamental data slumps, and the total nonsense with regard to ‘cash on the balance sheets’ when it is all levered to the max. But when it comes to showing just who is buying the hope… and who is selling the hype, the following chart from BofAML sums it all up… institutional clients sold the most since January and the 4th most on record in the last week as retail clients continued their buying streak. Institutional clients are dumping equities off to retail clients… thank you very much…
Last week, during which the S&P 500 was down 0.1%, BofAML clients were net sellers of $1.5bn of US stocks following a week of net buying.
Net sales were chiefly due to institutional clients, who have now sold stocks for the last five consecutive weeks and are the biggest net sellers year-to-date. Net sales by this group last week were their largest since January and the fourth-largest in our data history (since 2008).
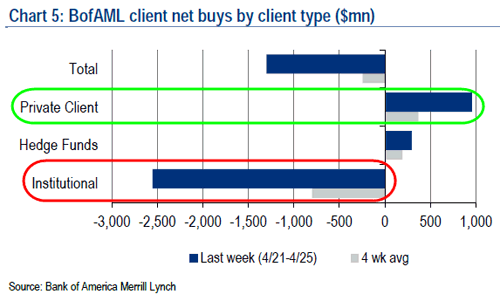
Hedge funds were net buyers for the fourth consecutive week, and private clients also continued their net buying streak.
Read more …
No sh*t.
• Bank Of England Warns Housing Market Boom May Turn To Crash (Guardian)
Britain’s booming housing market could be heading for a fresh crash, the Bank of England said in its toughest warning yet about the dangers of the return of rapidly rising property prices. Sir Jon Cunliffe, Threadneedle Street’s deputy governor for financial stability, said it would be dangerous to ignore the momentum apparent across the country and dropped strong hints of new measures to slow down the market in the months ahead. On a day when it emerged that one in 15 London homes are now selling for £1m or more, Cunliffe said Britain had a history of booms turning to bust. “This is a movie that has been seen more than once in the UK.”
The Bank’s deputy governor said that there were always risks to financial stability “blinking on the dashboard” but made clear his concern about the possibility that borrowers taking on large mortgages could find themselves in trouble when interest rates inevitably rose. “The growing momentum in the market is now in my view the brightest light on that dashboard”, Cunliffe said. “It has not yet been accompanied by a substantial increase in aggregate mortgage debt, though gross mortgage lending is growing and there are signs that debts are becoming more concentrated.”
Cunliffe said the housing market could have a “soft landing” as houses became less affordable and lenders tightened up the conditions for granting homes loans. “But other outcomes are very possible and the financial policy committee [FPC] will need be both vigilant and ready to act.” He said the risk was of “a major overshoot in prices and buildup in debt followed by a sharp correction with negative equity and an overhang of debt for many households”, adding: “Unfortunately, there are more precedents in UK for periods of a rapidly growing housing market to end in this way.”
Read more …
Very clear. Japan QE has killed Sony’s profits, and what more would you need to know?
• The Markets Just Sounded the Death Knell For QE (Phoenix)
The Central Bank intervention fiasco continues to unravel before our eyes. Globally all Central Banks have kept an eye on the Bank of Japan, which announced the single largest QE program relative to its GDP in history. That one single QE program announced in April 2013 is equal to over 20% of Japan’s GDP. Japan experienced two brief quarters of improved economic activity, before things turned south again. Turns out that printing trillions of dollars to buy bonds doesn’t create growth. The latest example is Sony, the Japanese electronics giant which just announced a 70% COLLAPSE in its profit outlook. Sony’s CEO had stated previously that a weak Yen, caused by the Bank of Japan’s QE program was actually a “disadvantage.” We now have concrete proof as Sony’s profits outlook evaporates. This is the death knell of QE.
We now know for a fact that the Fed and other Central Banks are aware that QE doesn’t create jobs nor does it improve the broader economy. All that leaves is stocks… which have benefitted enormously from QE, with the S&P 500 rising to new record highs boosted by the Fed’s money printing. However, ultimately stocks react to profits. And as Sony has proven, QE hurts rather than helps profits. Indeed, Sony’s stock is down over 1.5% on the earnings outlook drop. And it’s essentially breakeven since the Bank of Japan announced its massive QE program. The writing is on the wall. QE is good for very little these days. If the Bank of Japan can spend over $1.4 TRILLION and corporate profits fall while stocks go nowhere, it’s the end of the line for Central Bank money printing.
Read more …
We already know the answer to that question, but why not see it again?
• What $1.4 Trillion In QE Buys The US Economy (Zero Hedge)
Back in December of 2012, the Fed, after two and a half failed attempts to stimulate the economy (via QE1, QE2 and Operation Twist), announced Open-Ended QE of an indefinite injection of $85 billion per month (which it currently is tapering at a pace of $10 billion per month on the realization that it has soaked up virtually all high quality collateral). Since then the Fed’s balance sheet has grown from $2.9 trillion to $4.3 trillion: a direct injection of $1.4 trillion in liquidity into the stock market, if not so much the economy, which as Wall Street is suddenly busy telling us following the latest disappointing construction spending data (the same Wall Street which initially expected Q1 GDP to be 2.75%), probably contracted for the first time in three years!

There’s even better news: if the next quarter shows the US economy contracting again – and with the “beneficial” impact of Obamacare fading, global trade stuck in the doldrums, and US consumers tapped out with near record low savings this is a distinct possibility – the US will officially enter a recession. And this ignores the terrifying possibility of even more rain in the spring, not to mention the mortal threat of El Nino in the summer. Then the US is virtually assured an all out collapse into depression.
Read more …
Why am I not surprised to see this?
• Freddie Mac Enters Trailer Park Loans Market (Bloomberg)
Want to buy a trailer park? Freddie Mac wants to give you a loan. The unit of the government-owned mortgage giant that funds apartment buildings is set to begin financing manufactured-housing communities, the company said in a statement today. The firm is broadening its reach in the multifamily segment of the housing market as it seeks to fulfill its mandate to provide affordable options for low-income families. The McLean, Virginia-based lender will work with established companies in the industry across the U.S., said David Brickman, the head of multifamily operations at Freddie Mac. “It’s rounding out our ability to touch the affordable housing space,” Brickman said today in a telephone interview. “Manufactured housing is a big piece of rural affordable housing.”
Warren Buffett, the billionaire chairman of Berkshire Hathaway Inc., lamented the punitive rates charged to purchase factory-built homes in his 2009 annual letter to shareholders. Berkshire owns Clayton Homes Inc., a builder of the properties. Without funding from Fannie Mae and Freddie Mac, owners of the housing complexes are forced to pass on higher debt costs to the families they serve. Freddie Mac plans to package the debt into bonds with its more conventional apartment loans. The company issued $3.9 billion of commercial-mortgage bonds linked to multifamily properties during the first quarter. Sales of the debt reached $28 billion in 2013.
Read more …
Is it horror movie season again already? WTF?
• US Banks Slide Back Towards Subprime Credit Standards (Bloomberg)
U.S. banks are easing credit standards in search of a safe and profitable middle ground after an era of reckless home lending gave way to the stiffest rules in decades, putting a damper on the housing recovery. Wells Fargo the biggest U.S. home lender, two weeks ago cut its minimum credit score for borrowers of Fannie Mae-and Freddie Mac-backed loans to 620 from 660. The step followed moves by smaller lenders, such as the U.S. unit of Canada’s Toronto-Dominion Bank, which lowered down payments to 3% without requiring mortgage insurance for some loans.
Banks ratcheted up borrowing requirements after the most severe housing crash since the Great Depression, preventing as many as 1.2 million loans from being made in 2012, according to an Urban Institute paper. Lenders rode a wave of refinancing until a spike in borrowing costs last year gutted demand, forcing the biggest banks to cut more than 25,000 mortgage jobs. Now they’re removing barriers to mortgages for some borrowers in hopes of reviving a shrinking market. “We threw the baby out with the bathwater because we had to,” said Rick Soukoulis, chief executive officer of San Jose, California-based lender Western Bancorp. “From there, you start to inch back. If you keep selling only what isn’t selling, you’re just dead.”
In March, credit standards were the loosest in at least two years, according to a Mortgage Bankers Association index. The measure, based on underwriting guidelines, rose to 114 from 100 when it started in 2012. The index would have been at about 800 in 2007, meaning credit was eight times looser that year, before standards were tightened. Home buyers with higher debt and lower FICO credit scores are now a growing minority among borrowers of loans backed by Fannie Mae and Freddie Mac, the government-owned mortgage giants. Almost 16% of the mortgages for home purchases in March went to borrowers with monthly debt obligations exceeding 43% of their pay, according to data compiled by Morgan Stanley. That’s up from 13.4% in mid-2012. Federal rules deployed in January expose lenders to liabilities if their mortgages without government backing require payments that, when combined with other debts, exceed 43% of the borrower’s income, without proof they can be repaid.
Read more …
HAHA!
• IMF Warns Ukraine On Bailout If It Loses East (CNBC)
Ukraine, struggling with a stuttering economy as well as an escalating crisis with neighboring Russia, has had its $17 billion International Monetary Fund bailout signed off. But international lenders are already warning of threats to its funding. Christine Lagarde, IMF managing director, warned “further escalation of tensions with Russia and unrest in the east of the country pose a substantial risk to the economic outlook.” In a staff report on the aid program, published Thursday, the IMF added that a change to eastern Ukraine’s borders could force it to adjust its bailout.
“The unfolding developments in the east and tense relations with Russia could severely disrupt bilateral trade and depress investment confidence for a considerable period of time, thus worsening the economic outlook,” it said. “Should the central government lose effective control over the east, the program will need to be re-designed.” The detention of Russia’s military attaché to Kiev by Ukrainian police on Thursday morning highlighted concerns that the tensions gripping the country are unlikely to go away. The IMF predicts Ukraine’s economy to shrink by 5% at least this year. The country has been hidebound by corruption in business and politics. New anti-corruption laws are expected, but their effectiveness remains to be seen.
Read more …
The EU in all its blindness has little chance of seeing that wall coming.
• Russia Sues EU Over ‘Third Energy Package’ (RT)
Russia has filed a lawsuit with the World Trade Organization (WTO) over the EU’s so-called ‘Third Energy Package,’ according to media reports. “This procedure is provided for in the rules of the Organization,” a source said, adding that “Russia sent a note to the EU Mission at the WTO and notified the WTO Secretariat thereof,” Itar-Tass news agency reported. A second news agency, Interfax, stated that a “source close to WTO” spoke of “the start [of a] court examination.” The agency said it obtained confirmation from the director of the Ministry of Economic Development’s department of trade negotiations, Maksim Medvedkov.
Signed in 2007, the Third Energy Package outlines a set of rules regulating the European gas and electricity market. The European Commission insists the Third Energy Package was aimed at increasing competition on the energy market, allowing other players to join the sector and liberalizing energy prices. One of the core elements prohibits a single company from both owning and operating a gas pipeline and contains rules on third party access to the natural oil transportation grid. “These and other elements of the Third Energy Package, in the opinion of Russia, contradict the obligations of the EU in WTO on basic principles of non-discrimination and market access … the Third Energy Package creates serious obstacles to ensure a stable supply of Russian gas to the EU, including a threat to the construction of new transport infrastructure, for example, in the framework of the ‘South Stream,’” Medvedkov told Interfax.
Moscow broke ground on the South Stream project after securing agreements with intergovernmental agreements with all countries which the pipeline would pass through: Austria, Bulgaria, Hungary, Greece, Serbia, Slovenia, and Croatia. The Third Energy regulation mandates 50% of the pipeline can be operated by Russia’s Gazprom, but the other 50% must be operated by a third party, a condition Russian energy ministers do not accept, as Gazprom is the only company that has the right to export gas via pipeline.
Read more …
• Ukraine’s Gas Debt To Russia Reaches $3.5 Billion (RT)
Ukraine’s gas debt to Russia has hit $3.5 billion, according to preliminary data released on Wednesday, a Gazprom official told reporters. The new data includes Ukraine’s Naftogaz order as of April 30 and those volumes that were already supplied this month, Sergey Kupriyanov stated. Ukraine’s energy minister, Yury Prodan, responded, stating that Ukraine does now agree with Russia’s gas debt estimate of US$3.5 billion, UNN news agency reported. Prodan added that Ukraine continues to insist on the price of $268.5 per 1,000 cubic meters for Russian gas.
Last week, Russian energy minister Aleksandr Novak said that Ukraine’s growing gas debt may lead to the failure of the country’s transit obligations and the reduction of gas supplies to southeastern Europe. The debt may force a situation where not enough gas will be pumped into Ukrainian underground storage facilities, which may create the risk of non-performance by Ukraine of its transit obligations and of an undersupply of gas to southeastern Europe, the minister stated. In December, Russia provided Ukraine with a $3 billion loan, which was part of a larger $15 billion aid package agreed the same month. Moscow also offered a 33% gas price discount that would have saved more than $7.5 billion.
In April, Russia’s President Vladimir Putin said that Russia cannot continue to prop up Ukraine’s faltering economy. “The Russian Federation doesn’t recognize the legitimacy of the authorities in Kiev, but it keeps providing economic support and subsidizing the economy of Ukraine with hundreds of millions and billions of dollars. This situation can’t last indefinitely,” Putin said. Ukraine has not paid for Russian gas since the beginning of 2013, and with all discounts withdrawn it is now charged $485 per 1,000 cubic meters of gas.
Read more …
According to the IMF …. What kind of source is that? Is the IMF independent?
• How The Russian Economy Has Taken A Turn For The Worse (Guardian)
Russia’s economy was struggling even before the crisis in Ukraine, but things have now taken a turn for the worse, according to the International Monetary Fund. GDP fell in the first three months of 2014 and will fall again in the second quarter. According to the technical definition, that would amount to a recession. The news will come as little surprise to the European Bank for Reconstruction and Development, which counts Russia as its biggest client. The EBRD believes there will be little or no growth this year even assuming there is no further escalation in the crisis.
Russia has five big problems. The first is that its manufacturing sector is uncompetitive after being starved of investment. The second is that the lack of a thriving industrial base has made the economy even more dependent on its oil and gas sector. The third is that a combination of a struggling economy, the Ukraine crisis and endemic corruption has led to capital flight. Goldman Sachs has estimated that up to $50bn (£30bn) has left Russia since the start of 2014 and that the full year figure could be as high as $130bn.
The fourth problem is that, with cash leaving the country and little or no investment coming in, the value of the rouble has fallen sharply. That has forced the central bank to push up interest rates, further depressing growth. Finally, there’s the threat of sanctions. These are not having a direct impact but the threat of tougher action to come is weighing down on confidence. Analysts at Capital Economics say that a worsening of the crisis could lead to the Russian economy contracting by 5% in 2014.
Read more …
All QE does that. It’s in the design.
• Draghi QE Plan Seen Helping Banks Not Business (Bloomberg)
Mario Draghi’s plan to spur growth by getting the European Central Bank to buy asset-backed securities and persuade lenders to sell more of the bonds is being met with skepticism by the region’s biggest money managers. The ECB’s president is considering broad-based asset purchases, known as quantitative easing, to ward off deflation. He’s also promoting the market for bonds backed by loans to small- and medium-sized enterprises in a bid to increase funding to the businesses that employ about 70% of the European Union’s private-sector workers.
Draghi is seeking to free up bank balance sheets by reviving Europe’s $2.1 trillion ABS market, which contracted 32% since 2009 as regulators cracked down on the debt blamed for deepening the financial crisis. With lenders’ profits being squeezed by tougher capital rules, money managers are concerned they’ll use the opportunity to boost earnings. “It would be nice for banks as they could fund very cheaply, but would they pass on the cheap funding to customers or will they keep the higher profit margin themselves?” said Frank Erik Meijer, head of ABS at Aegon Asset Management in The Hague, which oversees 250 billion euros ($347 billion) of assets. “I don’t see SMEs benefiting a lot because banks will probably try to keep the additional profit margin to increase their capital base.”
Read more …
But 288,000 jobs! Speed up the taper!
• Yellen’s Fed Resigned to Diminished Growth Expectations (Bloomberg)
Federal Reserve Chair Janet Yellen and her colleagues have lowered their sights on how fast the economy needs to expand to meet their goal of cutting unemployment. No longer are they saying growth must accelerate from the 2% to 2.5% pace it has generally averaged since the recession ended. Instead, they are stressing the importance of preventing the expansion from faltering. Exhibit number one: the Fed chief herself. Yellen said on April 16 that a key question facing the central bank is what “may be pushing the recovery off track.” Contrast that with her comments on March 4, 2013, of the importance of seeing “a convincing pickup in growth.”
The central bank on April 30 pushed ahead with its plan to gradually wind down its asset-purchase program in spite of news earlier in the day that growth ground to a virtual halt in the first quarter. Saying the economy is rebounding, the Federal Open Market Committee voted unanimously to reduce its bond purchases by another $10 billion a month, to $45 billion. “Monetary policy has become very passive compared to where it was before,” said Neal Soss, chief economist at Credit Suisse Group AG in New York and a one-time assistant to former Fed Chairman Paul Volcker. Most FOMC participants forecast gross domestic product growth of 2.8% to 3% this year and 3% to 3.2% in 2015, according to projections released March 19.
Read more …
Yeah, sure.
• New York Attorney General Eyes Exchanges In High Frequency Probe (Reuters)
The New York Attorney General’s office is seeking information from exchanges and alternative trading platforms about their relationships with high frequency trading firms, as part of its probe into allegedly unfair trading practices on Wall Street, according to sources familiar with the situation Attorney General Eric Schneiderman’s office is expected to send subpoenas within days to exchanges, one of the sources said on Thursday. Another source said major banks that operate dark pools, or platforms where trades take place out of sight of the rest of the market, have been sent letters asking for information.
The major U.S. exchange operators include IntercontinentalExchange Group, Nasdaq and BATS Global Markets. NYSE, a unit of ICE, has already been cooperating with the attorney general by sharing data, while BATS has also had conversations with the prosecutor, two of the sources said. Nasdaq Chief Executive Robert Greifeld said in an interview on April 24 that his company had not been subpoenaed. The expected move by Schneiderman’s office shows how investigations into the practices of high-frequency trading firms are broadening. The U.S. Securities and Exchange Commission, Commodity Futures Trading Commission and Federal Bureau of Investigation have also said they had several active probes into high-speed and automated trading.
Read more …
Nadamaskakas.
• How Canada’s Flirtation with a China Oil Market Soured (Bloomberg)
Stephen Harper was in need of a new friend with a big appetite for oil. The Americans just weren’t cutting it. It was February 2012, three months since President Barack Obama had phoned the Canadian prime minister to say the Keystone XL pipeline designed to carry vast volumes of Canadian crude to American markets would be delayed. Now Harper found himself thousands of miles from Canada on the banks of the Pearl River promoting Plan B: a pipeline from Alberta’s landlocked oil sands to the Pacific Coast where it could be shipped in tankers to a place that would certainly have it – China. It was a country to which he had never warmed yet that served his current purposes.
Harper stood before a business audience in a luxury hotel banquet hall in Guangzhou, capital of China’s most populous province, putting on his best pro-China face while touting his nation’s virtues. “Canada is not just a great trading nation; we are an emerging energy superpower,” he said surrounded by a phalanx of red Chinese and Canadian flags. Oil was top of mind. He noted that a single country – the U.S. – took 99% of Canada’s exports, a situation he described as contrary to Canada’s commercial interests. “You know,” he said, “we want to sell our energy to people who want to buy our energy. It’s that simple.” The Chinese and Canadians in attendance had long waited for Harper to embrace the Chinese economic juggernaut. They held him up for half-an-hour posing for pictures.
As he finally took his seat for a group photo with the organizers, he turned to Peter Harder, a former deputy minister of foreign affairs and president of the Canada China Business Council. “Do you think the Americans were listening?” he asked. That Harper now found himself in the People’s Republic hawking Alberta’s oil spoke to the depth of his frustration with Obama. His view, according to people close to Harper who knew his thinking but aren’t authorized to speak, was that sensible Americans would understand the folly of allowing Canada’s massive oil sands reserves, estimated at 168 billion recoverable barrels, to be sucked up by China, a rising economic and political rival. Yet if the Americans – most particularly a president inclined to indulge his green base at Canada’s expense – didn’t pay heed, then Harper had primed the pump to do business with the Chinese.
Read more …
Free market competition.
• Japan Prepares to Enter the Arms Market (Bloomberg)
Keenly aware of the trouble that came with ambitious generals and an expanding munitions industry, the Japanese government has long banned most weapons exports. That policy helped buttress Japan’s pacifism, but it also hindered the growth of the country’s defense industry. Because it couldn’t sell parts overseas, Japanese defense companies missed out on chances to develop tanks, fighter jets, and other weaponry with the U.S. The ban “has resulted in an isolated Japanese defense industry that produces very small quantities at very high cost,” says Lance Gatling, president of Nexial Research, a defense consulting company in Tokyo.
Japan’s Asian neighbors have taken advantage of its absence from the export scene. South Korea exported $3.4 billion worth of arms in 2013, up from $1.2 billion in 2010. China last year passed France and Britain to become the world’s fourth-largest arms exporter, behind only the U.S., Russia, and Germany, according to the Stockholm International Peace Research Institute. In April, the government of Japan’s conservative prime minister, Shinzo Abe, lifted a ban from the 1970s that restricted arms exports. The country’s contentious relations with China, which claims Japanese-controlled islands in the East China Sea, made getting rid of the ban politically much easier for Abe, even though a recent poll suggests most Japanese citizens don’t support loosening export restrictions. The old policy “was too strict,” says Tsuneo Watanabe, director of policy research and senior fellow at the Tokyo Foundation. “The voice of pacifism is getting lower because of tensions with China”.
Read more …
Oh yeah buddy.
• Economics Is Too Important To Leave To The Experts (Guardian)
You wouldn’t have guessed it, given the fanfare surrounding the 0.8% growth figure for the first quarter of 2014, but people in the United Kingdom have been living through a period worse than Japan’s infamous “lost decade” of the 1990s. During that time, Japan’s per capita GDP grew at 1% per year. This means that in 2000, Japan’s per capita GDP was 10.5% higher than in 1990. In the UK, per capita GDP at the end of 2013 was 6.6% lower than that in 2007. This means that, unless the UK economy miraculously grows at around 5% a year for the next four years (factoring in population growth rate of around 0.7% a year), it is going to have a decade that is even more “lost” than Japan’s 1990s.
The costs of the 2008 crisis in terms of human welfare have been even greater than the growth figures suggest. Unemployment is still nearly 7%, or at 2.24 million, depriving people of dignity and putting them under huge stress. Real wages have had some of the biggest falls in the OECD bloc of 34 countries and have a long way to go before they can recover to pre-crisis levels. Steep cuts in welfare spending have hit many of the poorest hard. Increasing job insecurity, symbolised by the rise of zero-hours contracts, has been making workers’ lives more stressful. The spread of food banks, the popularity of “poverty recipes” in cookery, and the advance of German discount supermarket chains, such as Aldi and Lidl, are the more visible manifestations of this pressure on the living standards of citizens.
What is more, even this sorry achievement has been made on the reversion to the economic model whose bankruptcy was laid bare by the 2008 crisis. That model was predicated on the deregulated financial system fuelling unsustainable growth by creating asset bubbles, one of the highest household debts in the world (as a proportion of GDP), and a large current account deficit. How has this mess been created? The mismanagement of the crisis by the coalition government means it has to bear significant blame, but the main cause lies in the nature of the economic model that the UK has pursued for three decades.
Read more …
• Demise of the Trickle-Down Delusion (Barry Ritholtz)
Any reader of this site has likely heard about the book currently setting the world of economics aflame. “Capital in the Twenty-First Century” was written by a French economist named Thomas Piketty. It is on the New York Times best-seller list and is currently sold out, with its publisher scrambling to print more copies. [..] The data-driven demolition of trickle-down economics has the Ayn Rand crowd panicked. But what I find so fascinating about this debate (having not yet read the book, though I plan to) is the inability of the economic right wing to respond. Thus far they have been rendered impotent, unable to construct an intelligent counterargument. The strongest response so far — and I am not making this up — has been to give the book a single-star rating on Amazon.com’s website.
Alexander Kaufman at the Huffington Post collected some of the more amusing one-star reviews. There wasn’t a single verified purchaser of the book on the entire, absurd list. Which raises a question about John Stuart Mill’s notion of the marketplace of ideas: Is the debate driven by the quality of ideas, or by the marketing, branding and PR behind it? Ralph Waldo Emerson wrote “Build a better mouse trap and the world will beat a path to your door.” All tech entrepreneurs quickly learn that this isn’t true. The better mouse trap is merely the first step, which might get you some venture-capital funding if you have a good pitch book and a winning personality. Regardless of your views on Piketty’s thesis, it raises an interesting epistemological question: Was Mill wrong?
How could the “worse” idea win in the market place? If you believe trickle-down economics is a fraud, how did it dominate the world of economics for so many decades? If you think Piketty’s work is just so much nonsensical Marxism, why has it received so much acclaim from the economics profession and public alike? Perhaps Mill’s marketplace of ideas suffers the same flaw as the efficient-market theory, or the idea that prices reflect all information and investors can’t beat the market over time. A decade ago, I called it “The kinda-eventually-sorta-mostly-almost Efficient Market Theory.” Markets are filled with all sorts of inefficiencies and friction. They eventually get it more or less correct, but along the way, they can deviate from the true path of efficiency. We just need to wait a decade or three for that efficiency to sort itself out.
Read more …
• How And When The Bubble Finally Bursts (Jeremy Grantham)
There has been much discussion in the past year(s) whether the Fed has inflated (the final) bubble. Sadly, most of it has been misguided. To get some “guided” analysis of what is easily the most important market topic of the day, we go to GMO’s Jeremy Grantham and his latest quarterly letter covering just this: “Looking for Bubbles.” First the background:
What is a bubble? Seventeen years ago in 1997, when GMO was already fighting what was to become the biggest equity bubble in U.S. history, we realized that we needed to define bubbles. By mid-1997 the price earnings ratio on the S&P 500 was drawing level to the peaks of 1929 and 1965 – around 21 times earnings – and we had the difficult task of trying to persuade institutional investors that times were pretty dangerous. We wanted to prove that most bubbles had ended badly. In 1997, the data we had seemed to show that all bubbles, major bubbles anyway, had ended very badly: all 28 major bubbles we identified had eventually retreated all the way back to the original trend that had existed prior to each bubble, a very tough standard indeed.
Then, the bullish case, or in other words, what is the maximum the S&P can stretch further, before it all comes crashing down:
So now, to get to the nub, what about today? Well, statistically, Exhibit 3 reveals that we are far off the pace still on both of the two most reliable indicators of value: Tobin’s Q (price to replacement cost) and Shiller P/E (current price to the last 10 years of inflation-adjusted earnings). Both were only about a 1.4-sigma event at the end of March. (This is admittedly because the hurdle has been increased by the recent remarkable Greenspan bubbles of 2000 and a generally overpriced last 16 years.) To get to 2-sigma in our current congenitally overstimulated world would take a move in the S&P 500 to 2,250. And you can guess the next question we should look at: how likely is such a level this time? And this in turn brings me once again to take a look at the driving force behind the recent clutch of bubbles: the Greenspan Put, perhaps better described these days as the “Greenspan-Bernanke-Yellen Put,” because they have all three rowed the same boat so happily and enthusiastically for so many years.
Read more …
Sombody shoot Australia!
• UNESCO Slams Barrier Reef Dumping Plans (RT)
UNESCO has condemned the Australian government’s approval of dumping dredged sand and mud in the waters of the Great Barrier Reef. The UN body warned that if the plan is not revised, the Reef’s World Heritage status could be downgraded. The decision to allow three million cubic meters of dredge waste to be disposed of in the Barrier Reef was made in January by an Australian government agency overseeing the area. The waste comes from the earlier approved expansion of the country’s port of Abbot Point – to make way for extensive coal shipments.
In its first comment on the issue, the United Nations Educational, Scientific and Cultural Organization (UNESCO) expressed “concern” and “regret” at the decision, which it believes was premature. It was taken before a thorough analysis of the impact it might have on the World Heritage site. “Indeed, this was approved, despite an indication that less impacting disposal alternatives may exist,’’ UNESCO said on Thursday in a draft report on the reef’s World Heritage status to the World Heritage Committee. The body has urged the government to reconsider the dumping plan and in case it proves to be the least damaging option, submit evidence proving the point. UNESCO has on the whole noted “serious decline in the condition of the Great Barrier Reef, including in coral recruitment and reef-building across extensive parts of the property.”
Read more …
I can’t wait for the first sinkhole to swallow a bunch of oil companies. It would work even better if an entire town disappears, because the whole land casino would be gone in a heartbeat, but I’d never want that for the people in the town.
• Fracking-Linked Earthquakes Likely To Worsen (RT)
Ongoing hydraulic fracking operations will only exacerbate seismic activity, leading to heightened earthquakes in areas where wastewater is injected deep underground, according to new research. To unleash natural gas, hydraulic fracturing – or fracking – requires large volumes of water, sand, and chemicals to be pumped underground. Scientists attending the Seismological Society of America (SSA) annual meeting said Thursday that this storage of wastewater in wells deep below the earth’s surface, in addition to fracking’s other processes, is changing the stress on existing faults, which could mean more frequent and larger quakes in the future.
Researchers previously believed quakes that resulted from fracking could not exceed a magnitude of 5.0, though stronger seismic events were recorded in 2011 around two heavily drilled areas in Colorado and Oklahoma. “This demonstrates there is a significant hazard,” said Justin Rubinstein, a research geophysicist at the US Geological Survey (USGS), according to TIME magazine. “We need to address ongoing seismicity.” Not all of the more than 30,000 fracking disposal wells are linked to quakes, but an accumulating body of evidence associates an uptick in seismic activity to fracking developments amid the current domestic energy boom. The amount of toxic wastewater injected into the ground seems to provide some clarity as to what causes the earthquakes. A single fracking operation uses two to five million gallons of water, according to reports, but much more wastewater ends up in a disposal well.
“There are so many injection operations throughout much of the US now that even though a small fraction might induce quakes, those quakes have contributed dramatically to the seismic hazard, especially east of the Rockies,” said Arthur McGarr, a USGS scientist. The USGS researchers spoke with reporters via conference call on Thursday. Scientists believe the cumulative effect of these operations could result in larger quakes becoming more common over time. “I think ultimately, as fluids propagate and cover a larger space, the likelihood that it could find a larger fault and generate larger seismic events goes up,” Gail Atkinson, professor of earth sciences at Western University in Ontario, Canada, said at the SSA meeting.
Read more …


