Jun 232018


Henri Matisse The goldfish 1912


Greece Swaps Bailout Hell For Eternal Purgatory (R.)
Euro Is Here To Stay: German Finance Minister (R.)
Can You Think of Any Other Ways to Spend $716 Billion? (Taibbi)
Ike Was Right! (Bill Bonner)
Irish House Prices Sky-High Due To Finance Not Scarcity (Pettifor)
Trump Threatens 20% Tariff On European Union Cars (R.)
Social Security Benefits Buy 34% Less Than In 2000 (CNBC)
In 2010 Britons Stopped Getting Any Older. The Implications Are Huge (G.)
Airbus Raises Range Of Fears In Brutal Brexit Assessment (G.)
Trump’s Family Separation Scandal Reveals Every Species of Hypocrite (Taibbi)
Don’t Cry for Me, Rachel Maddow (Kunstler)
Fact-Check: Was Migrant Girl On US Border Taken From Mother? Unfounded (AFP)
Children In Custody At Border To Be Reunited With Families By End Of Day (CBS)
US Judge Says May Rule Next Week On Reuniting Migrant Children (R.)
Survivors Report 220 Migrants Drown Off Libya In Recent Days (R.)
Starving Seabirds On Remote Island Full Of Plastic (BBC)


A terrible deal.

Greece Swaps Bailout Hell For Eternal Purgatory (R.)

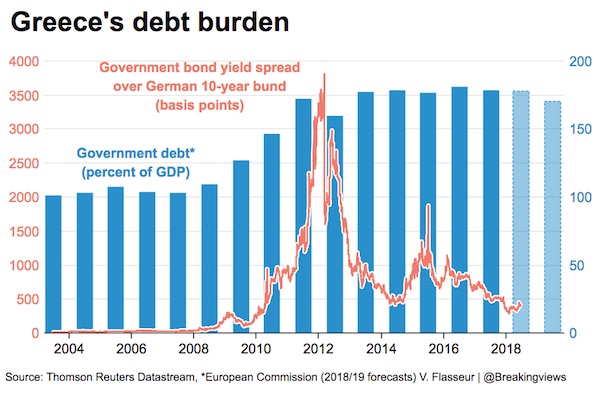
Greece is swapping bailout hell for eternal purgatory. Eight years after it first sought outside financial assistance Athens can at last support itself, helped by extra euro zone funds and debt relief. But it will have to maintain a tight budget for decades, while doubts over its debt sustainability will linger. The latest deal suits both European creditors and Greek Prime Minister Alexis Tsipras. With the country’s third bailout coming to an end in August, both sides wanted a clean exit, without a backstop facility. Euro zone countries recoiled at the idea of granting Greece more credit, while Tsipras wants to claim that the country is finally free of austerity. Both Ireland and Portugal ended their bailouts in this way.

But Greece still owes a hefty 180% of GDP, because official lenders refused to write off the debt. True, the euro zone has extended repayments over many decades. Still, the International Monetary Fund’s reluctance to describe the debt as sustainable made a smooth exit less certain. Hence the latest dollop of debt relief. Lenders have given Greece the last €15 billion of the bailout to build a cash buffer. They also extended their loans by 10 years, meaning Greece should not face large repayments until the 2030s. Creditors will also lower interest rates and transfer the profit on Greek bonds bought by the ECB as long as the country sticks to reform targets. The deal should make it possible for Greece to survive without further financial help for at least a decade.

But the country’s junk credit rating and the absence of a backstop means government bonds won’t be eligible as collateral for ECB loans. This will force banks to find other, more expensive sources of funding. The other question is whether Greek debt can be sustained without a default or further writedowns. If the government delivers on its promise to maintain a budget surplus before interest payments of over 3.5% of GDP – three times the euro zone average – until 2022, and 2.2% thereafter, the debt load will slowly fall. Yet Greece’s unemployment rate of 20% is more than twice as high as in the rest of the single currency area. And euro zone officials will still visit every quarter. The country has escaped its bailout hell, but is hardly free.

Read more …

Again, this is like a team owner stating publicly that he supports the coach 100%.

Euro Is Here To Stay: German Finance Minister (R.)

The euro is irreversible, German Finance Minister Olaf Scholz said in a newspaper interview to be published on Saturday when asked if the single currency will still be there in 10 years. “Yes, the euro is irreversible,” Scholz told the Rheinische Post. “It secures our common future in Europe.” He added that an initial blueprint to strengthen the euro zone agreed between Chancellor Angela Merkel and French President Emmanuel Macron during talks at the Meseberg retreat outside Berlin this week would shield the euro from crises. “With the Meseberg agreements we are further building the house of Europe,” he said. “It contains a sealed roof that withstands future storms and rainy days. We have a new momentum in Europe and this is thanks to President Macron.”

Read more …

Don’t question the military.

Can You Think of Any Other Ways to Spend $716 Billion? (Taibbi)

While the world continues to be transfixed over the gruesome images coming from the border, business went on as usual in Washington. Earlier this week, the Senate quietly passed the $716 billion “John S. McCain National Defense Authorization Act for Fiscal Year 2019.” The bill, which passed 85-10 in a massive show of bipartisan support, represents a considerable boost in defense spending across the board – roughly $82 billion just for next year. The annual increase by itself is bigger than the annual defense budget of Russia ($61 billion) and the two-year jump of over $165 billion eclipses the entire defense budget of China ($150 billion).

The bill is a major win for Trump, who has made no secret about his desire to push through giant increases in military spending. The legislation even sends the U.S. down the road to meeting the Trump administration’s lunatic goal of developing smaller, more “flexible” (read: usable) nuclear weapons, as it includes $65 million for the development of a new, lower-yield, submarine-launched nuke. But the problem with the defense bill, at least in terms of attracting coverage, is that it’s also a big win for almost every other major political constituency in Washington. Spending on defense lobbying has actually been dropping slightly in recent years, but that may only be because the opposition to defense spending has become so anemic that lobbyists don’t really need to bother anymore.

Read more …

“..the damage done by Germany’s hyperinflation of the early ’20s led to far more than just wiped-out mortgages and billion-dollar cigars.”

Ike Was Right! (Bill Bonner)

Our working hypothesis is that General Eisenhower was right. There were two big temptations to the American Republic of the 1950s; subsequent generations gave in to both of them. They spent their children’s and grandchildren’s money. Now, the country has a government debt of $21 trillion. That’s up from $288 billion when Ike left the White House. And they allowed the “unwarranted influence” of the “military/industrial complex” to grow into a monster. No president, no matter how good his intentions, can stop it. A corollary to our major hypothesis is that the rise of the Deep State (the military/industrial/social welfare/security/prison/medical care/education/bureaucrat/crony complex) was funded by the Fed’s fake-money system.

Now, investors, businesses, households, and the feds themselves have all been “faked out” by a fraudulent money system. None of them can survive a cutback in credit. For nearly 30 years, central banks have backstopped markets and flooded the world with liquidity. But last week, the Fed turned the screws a little further. It now targets a 2% Fed Funds Rate and claims to be on the path of “normalization.” And the ECB made it official, too; it hasn’t quite begun tightening, but it’s got its toolbox open. And command of the ECB work crew is set to change hands next year anyway, passing on to a German engineer.

The German psyche has been scarred by its awful experience in the last century. Even though today’s Germans didn’t live through it themselves, the entire country seems to have a race memory of it. Still preparing for hard times, the household savings rate in Germany is at least three times higher than in the sans souci U.S. Germany’s apocalypse, too, can be described in Eisenhower’s terms – too much debt (arising from World War I)… and too much influence in the hands of the military/industrial complex. Debt led to hyperinflation. But the damage done by Germany’s hyperinflation of the early ’20s led to far more than just wiped-out mortgages and billion-dollar cigars.

Read more …

Ireland and all the others.

Irish House Prices Sky-High Due To Finance Not Scarcity (Pettifor)

Economists regard the theory of supply and demand as nothing less than a “law” and as one of the fundamental principles governing “the economy”. Almost every economic event or phenomenon is considered the product of the interaction of the laws of supply and demand, argues The Concise Encyclopedia of Economics. The “law” is currently being invoked by those who believe the solution to the Irish housing crisis is to simply build more houses. It is an analysis echoed regularly by grateful developers and estate agents. But the “law” of supply and demand is a micro-economic concept and applicable only to the “economy” of individuals, households and firms.

The “economy” of a globalised country such as Ireland is, in stark contrast, a macro-economic concept, the result of analysing the aggregate activities of more than four million people operating within global markets for housing and other assets. As evidence of the flawed nature of this fundamental micro-economic theory, we only have to look at Ireland’s housing market in 2006 – the year in which the market boomed before imploding catastrophically. Irish home construction peaked in that year. In a country of just four million people, more than 90,000 homes were built. (By contrast the housing stock increased by just 8,800 between 2011 and 2016). And yet, despite this extraordinary increase in supply, and contrary to economic theory, prices in 2006 continued rising – by a whopping 11%.

Read more …

Just settle it amicably.

Trump Threatens 20% Tariff On European Union Cars (R.)

President Donald Trump on Friday threatened to escalate a trade war with Europe by imposing a 20% tariff on all U.S. imports of European Union-assembled cars. Trump posted his threat on Twitter the day European Union reprisals took effect against U.S. tariffs on European steel and aluminum. The EU targeted $3.2 billion in American goods exported to the 28-member bloc. “If these Tariffs and Barriers are not soon broken down and removed, we will be placing a 20% Tariff on all of their cars coming into the U.S. Build them here!” Trump wrote.

A month ago, the administration launched a probe into whether auto imports pose a national security threat. The United States currently imposes a 2.5% tariff on imported passenger cars from the European Union and a 25% tariff on imported pickup trucks. The EU imposes a 10% tariff on imported U.S. cars. German automakers Volkswagen, Daimler and BMW build vehicles at plants in the United States. Industry data shows German automakers build more vehicles in southern U.S. states that voted for Trump than they ship to the United States from Germany.

Read more …

Think medical bills.

Social Security Benefits Buy 34% Less Than In 2000 (CNBC)

If you feel like your Social Security check doesn’t stretch as far as it once did, there’s a likely explanation for it. Since 2000, the buying power of monthly benefits has fallen by more than a third, according to an annual report released Thursday by the Senior Citizens League, an advocacy group based in Alexandria, Virginia. In other words, the cost of goods and services common among retirees have collectively risen faster than the cost-of-living adjustment, or COLA, that Social Security recipients get every year. “People who recently retired might have seen only a [small] decrease in buying power,” said Mary Johnson, a policy analyst for the league. “But those retired for a long time are feeling the cumulative effect of this.”

About 47 million older Americans receive Social Security. Overall, the benefits comprise about a third of income among those age 65 or older, according to the Social Security Administration. The league’s annual report examines the costs that typically comprise household budgets of older Americans and compares their price change with annual COLAs. Based on those comparisons, the research found a 4% loss in Social Security buying power from January 2017 to January 2018 and a 34% decrease since 2000.

Read more …

Wonder if this is true only in Britain.

In 2010 Britons Stopped Getting Any Older. The Implications Are Huge (G.)

The most profound change to human life over the previous 100 years came to a halt in 2010. In the decades before it, life expectancy in Britain kept rising, with men, in particular, born in the 1920s and 1930s enjoying far longer and healthier lives than ever expected. This increase in lifespan has affected everything – from housing to health to pensions. It’s why we need to find ever greater sums for the NHS. It’s why the state pension age has had to go up. Arguably, it’s a big reason why house prices are so high – because people are living in them for longer. But the great leap forward in longevity has come to a shuddering halt.

An extraordinary analysis by the Office for National Statistics this week reveals that the trend line in longevity stopped in 2010, and has flatlined since. Why? Pick anything from austerity and cuts in NHS spending, to influenza outbreaks, obesity, diabetes, and even the rise of “multimorbidity” – where someone might have diabetes, heart disease and high blood pressure all at the same time. But the ONS did not try to answer the “why” question. It wanted to check if the statistics really do prove that longevity rises have come to a halt. And the depressing conclusion from its research is that, indeed they have. It found that the “breakpoint” in the trend towards better longevity began with males in the second quarter of 2009, with females following soon after.

Read more …

“The fear of “chaos at the borders” in 2020..”

Airbus Raises Range Of Fears In Brutal Brexit Assessment (G.)

Airbus hated Brexit from the off but, until now, it had confined itself to soft expressions of worry in public and harder lobbying behind the scenes. Its dramatic warning that it could stop investing in the UK is a radical departure from that position and carried a sting. The aircraft manufacturer did not merely say a no-deal outcome to Brexit talks “directly threatens Airbus’s future in the UK”. It also said an “orderly” Brexit, complete with a trade agreement and a transition period, would also be risky. In effect, the group will freeze investment in the UK until it can judge how a new set-up would work and how many extra costs its UK factories and research centres would bear.

John Longworth, the co-chair of Leave Means Leave campaign, accused Airbus of running a scare story and reheating Project Fear. Tariffs on aeronautical products are zero, he argued, and so “nothing will change” if the UK leaves the customs union. Yet he overlooked the detail of the Brexit assessment by Airbus, which barely mentioned tariffs. Instead, the worries were about the movement of employees between the UK and the EU, logjams in the supply chain and aircraft regulations. The most critical issue on that list is probably UK membership of the European Aviation Safety Agency (EASA), which certifies aircraft parts and runs safety checks.

In theory, the Civil Aviation Authority could do the job in the UK, as it once did, but Airbus doubts the body could assemble the expertise in time to provide a smooth transition. Norway is a non-EU member of EASA and so the UK, if it is prepared to accept the European court of justice as the legal authority behind EASA’s rulings, could also stay within. But a deal has not yet been struck, which is one of many reasons why Airbus is shouting that time is running short. Its supply chain frustrations will be shared by other large manufacturers with cross-border operations that run on a just-in-time basis to keep costs low. The fear of “chaos at the borders” in 2020, as Tom Williams, the Airbus executive in charge of the commercial aircraft division, put it, is real.

Read more …

“America’s manufacturing sector may be failing, but we still produce plenty of hypocrites.”

Trump’s Family Separation Scandal Reveals Every Species of Hypocrite (Taibbi)

John McCain, in Arizona receiving treatment for brain cancer, tweeted about Donald Trump’s barbarous immigration policy this week. “The administration’s current family separation policy is an affront to the decency of the American people, and contrary to principles and values upon which our nation was founded,” the senator wrote. Those comments bring to mind a commercial John McCain made eight years ago. At the time, he was facing a tough primary challenge from Tea Party Republican J.D. Hayworth. In the ad, McCain is seen walking along Arizona’s southern border with Pinal County Sheriff Paul Babeu, in the shadow of an enormous fence.

McCain starts tsk-tsking about the wave of crime pouring into his state. “Drug and human smuggling, home invasions, murder?” McCain asks. “We’re outmanned,” the sheriff says. “Of all the illegals in America, more than half come through Arizona.” McCain asks if they have “the right plan.” The sheriff says, “You bring troops, state, county and local law enforcement together.” “And complete the danged fence!” says McCain. [..] Trump’s policies on the border were and are monstrous. But those photos of children in captivity, which rightfully have been nearly as damaging to America’s reputation as the Abu Ghraib debacle, didn’t appear out of nowhere.

Those scenes are the latest in a long series of developments, under which politicians like McCain and Cruz and Dick Cheney, along with officials like Hayden, have gradually normalized the idea of human rights abuses as solutions to political problems. Now they’re all hiding behind someone else’s scandal. America’s manufacturing sector may be failing, but we still produce plenty of hypocrites.

Read more …

Democratic leadership has been AWOL for a long time.

Don’t Cry for Me, Rachel Maddow (Kunstler)

Actual political leadership among “the Resistance” is AWOL this week. Nancy Pelosi and Chuck Schumer failed to offer up any alternative legislative plan for sorting out these children differently. One can infer in the political chatter emanating from the Offendedness Cartel that immigration law is ipso-facto cruel and inhuman and that the “solution” is an open border. In theory, this might play to the Democratic Party’s effort to win future elections by enlisting an ever-growing voter base of Mexican and Central American newcomers. But it assumes that somehow these newcomers get to become citizens, with the right to vote in US elections — normally an arduous process requiring an application and patience — but that, too, is apparently up for debate, especially in California, where lawmakers are eager to enfranchise anyone with a pulse who is actually there, citizen or not.

Krugman of The Times really hit the ball out of the park today with his diatribe comparing US Immigration enforcement to the Nazis treatment of the Jews. As a person of the Hebrew persuasion myself, I rather resent the reckless hijacking of this bit of history for the purpose of aggrandizing the sentimentally fake moral righteousness of the Resistance. It actually diminishes the enormity of the Nazi campaign against European Jews. I daresay that commentary like Krugman’s will only serve to amplify a growing resentment of Jewish intellectuals in this country — including myself, increasingly the target of anti-Jewish calumnies and objurgations. You’d think that Mr. Trump had offered to blow up Ellis Island the way the Resistance is clamoring to pull down statues of Thomas Jefferson.

Read more …

That’s two in a row for using pictures out of context. Very damaging.

Fact-Check: Was Migrant Girl On US Border Taken From Mother? Unfounded (AFP)

Two photos that went viral on social media depict scenes that are not directly related to the family separations taking place on the US-Mexico border since early May. The most prominent, of Honduran two-year-old Yanela Varela crying inconsolably, has become a global symbol of the separations – helping to attract more than $18 million in donations for a Texas non-profit called RAICES. The photograph was taken on June 12 in McAllen, Texas by John Moore, a Pulitzer Prize-winning photographer for Getty Images. An online article about the picture, published by Time Magazine, initially reported the girl was taken from her mother, but was subsequently corrected to make clear that: “The girl was not carried away screaming by US Border Patrol agents; her mother picked her up and the two were taken away together.”

Time Magazine nonetheless used the image of the sobbing child on its cover, next to an image of President Trump looming over her, with the caption “Welcome to America”. The head of Honduras’ Migrant Protection Office Lisa Medrano confirmed to AFP that the little girl, just two years old, “was not separated” from her family. The child’s father also said as much. Denis Varela told the Washington Post that his wife Sandra Sanchez, 32, had not been separated from their daughter, and that both were being detained together in an immigration center in McAllen. Under fire for its cover – which was widely decried as misleading including by the White House – the magazine said it was standing by its decision. “The June 12 photograph of the 2-year-old Honduran girl became the most visible symbol of the ongoing immigration debate in America for a reason,” Time’s editor-in-chief Edward Felsenthal said.

Read more …

A mixed bag.

Children In Custody At Border To Be Reunited With Families By End Of Day (CBS)

Most of the immigrant children who’d been separated from their families and are still being held by U.S. Customs and Border Protection are expected to be reunited by the end of the day, a source with the Department of Homeland Security told CBS News. This does not reflect the greater number of children who are in the custody of the Department of Health and Human Services. That number was reported this week to be greater than 2,340. There will be a small number of children with Customs and Border Protection who will not be immediately reunited with their families. Reasons for delay may include if relationships can’t be confirmed or if authorities think there’s a risk to the child.

At the border, the government is trying to clear up who gets prosecuted and who does not. Confusion, however, hasn’t stopped border crossings, CBS News’ Mireya Villarreal reports. Shane McMahon’s client from El Salvador was charged with crossing into the U.S. illegally. He was separated from his 16-year-old son, and on Friday, those charges were suddenly dropped. “I think what’s happening is that everybody’s trying to figure out how the order applies to us and what to do with it,” McMahon said. The Trump administration says that nearly 500 children have been reunited with family. More than 1,800 remain separated from parents, who are desperate for answers.

Read more …

A case from February that could solve today’s issues.

US Judge Says May Rule Next Week On Reuniting Migrant Children (R.)

A federal judge said on Friday he could rule as soon as the middle of next week on a request to order the U.S. government to reunite thousands of immigrant children who were separated from their parents after illegally crossing the Mexico-U.S. border. While U.S. President Donald Trump bowed to political pressure on Wednesday and issued an executive order ending the separations, the administration has been silent on plans to reunite parents split from their children. More than 2,300 migrant children have been separated since the Trump administration began a “zero tolerance” policy toward illegal border crossings in early May.

At a court hearing on Friday, a lawyer for the American Civil Liberties Union pressed U.S. District Court Judge Dana Sabraw in San Diego to issue an injunction as soon as Friday evening to force the government to begin reuniting families. “Parents can’t find their children, they are not even speaking to their children. It’s a humanitarian crisis,” said Lee Gelernt, a lawyer for the ACLU, at Friday’s hearing. He asked the judge to order the government to reunite all children in 30 days, and in five days for children under the age of five. Gelernt also asked for an order barring separations.

[..] The judge peppered a government lawyer with questions about procedures for handling children separated from their parents and tracking by government agencies, and in general the government lawyer focused on arguments about legal procedure. The government has said in court papers that separation of children is a consequence of the lawful detention of the parent. The ACLU filed the case in February alleging the government violated the right to due process of two unidentified women, from Brazil and the Democratic Republic of Congo, when their children were removed from them.

Read more …

Europe outdoes Trump.

Survivors Report 220 Migrants Drown Off Libya In Recent Days (R.)

Survivors have reported that about 220 migrants drowned off the coast of Libya in the last few days while trying to reach Europe, putting the death toll this year on that route to more than 1,000, the United Nations said on Thursday. The U.N. refugee agency (UNHCR) said that as the summer season starts, the number of refugees and migrants attempting to cross the Mediterranean was expected to increase and it called for increased rescue operations. The Libyan coast guard has brought more than 8,000 people to disembarkation points along the coast this year, it said. Only five people survived the capsizing of a boat carrying 100 people on Tuesday, while the same day a rubber craft with 130 passengers sank, leading to 70 people drowning, UNHCR said.

On Wednesday a boat of refugees and migrants who were rescued reported that more than 50 people traveling with them had perished at sea, it said. “UNHCR is dismayed at the ever-growing numbers of refugees and migrants losing their lives at sea and is calling for urgent international action to strengthen rescue at sea efforts by all relevant and capable actors, including NGOs and commercial vessels, throughout the Mediterranean,” the agency said. Earlier, Libya’s coastguard picked up 443 African migrants on Thursday from three inflatable boats in trouble near its western coast, a spokesman said.

Read more …

Where’s the outrage? Why is there still no overall ban on one-use plastics? Why do I still see people walking around with plastic coffee cups?

Starving Seabirds On Remote Island Full Of Plastic (BBC)

New footage of the devastating impact of plastic pollution on wildlife has been captured by a BBC team. Seabirds are starving to death on the remote Lord Howe Island, a crew filming for the BBC One documentary Drowning in Plastic has revealed. Their stomachs were so full of plastic there was no room for food. The documentary is part of a BBC initiative called Plastics Watch, tracking the impact of plastic on the environment. The marine biologists the team filmed are working on the island to save the birds. They captured hundreds of chicks – as they left their nests – to physically flush plastic from their stomachs and “give them a chance to survive”.

The birds nest in burrows on Lord Howe Island, which is more than 600 kilometres off the east coast of Australia. While chicks wait in the burrow, the parents head out to sea and dive for small fish and squid to feed their offspring. “These birds are generalist predators,” explained marine biologist Jennifer Lavers who works with the shearwater colony. “They’ll eat just about anything they’re given. That’s what’s allowed them to thrive – a lack of pickiness. “But when you put plastic in the ocean, it means they have no ability to detect plastic form non-plastic, so they eat it.”

Parent birds unwittingly feeding plastic to their chicks means that the birds emerge from their burrows with stomachs filled with plastic, and with insufficient nutrition to enable them set out to sea and forage for themselves. But when the birds first head out of the burrow, the research team have been stepping in to help. “If the amount of plastic is not so significant, we use a process called levage, where we flush or wash the stomach – without harming the bird,” explained Dr Lavers. The BBC crew filmed the team working with individual chicks – using tubes to flush their stomachs with seawater and make them regurgitate the plastic.

Read more …

Jul 192016
 
 July 19, 2016  Posted by at 3:13 pm Finance Tagged with: , , , , , , ,  14 Responses »


M. King Hubbert

It’s been a while since we posted an article by our friend Euan Mearns, who was active at The Oil Drum at the same time Nicole and I were. Is it really 11 years ago that started, and almost 9 since we left? You know the drill: we ‘departed’ because they didn’t want us to cover finance, which we said was the more immediate crisis, yada yada. Euan stayed on for longer, and the once unequalled Oil Drum is no more.

On one of our long tours, which were based around Nicole’s brilliant public speaking engagements, we went to see Euan in Scotland, he teaches at Aberdeen University. I think it was 2011?! An honor. Anyway, always a friend.

And there’s ono-one I can think of who’d be better at explaining the Peak Oil Paradox in today’s context. So here’s a good friend of the Automatic Earth, Euan Mearns:


Euan Mearns: Back in the mid-noughties the peak oil meme gained significant traction in part due to The Oil Drum blog where I played a prominent role. Sharply rising oil price, OPEC spare capacity falling below 2 Mbpd and the decline of the North Sea were definite signs of scarcity and many believed that peak oil was at hand and the world as we knew it was about to end. Forecasts of oil production crashing in the coming months were ten a penny. And yet between 2008, when the oil price peaked, and 2015, global crude+condensate+NGL (C+C+NGL) production has risen by 8.85 Mbpd to 91.67 Mbpd. That is by over 10%. Peak oilers need to admit they were wrong then. Or were they?


Introduction


It is useful to begin with a look at what peak oil was all about. This definition from Wikipedia is as good as any:

Peak oil, an event based on M. King Hubbert’s theory, is the point in time when the maximum rate of extraction of petroleum is reached, after which it is expected to enter terminal decline. Peak oil theory is based on the observed rise, peak, fall, and depletion of aggregate production rate in oil fields over time.

Those who engaged in the debate can be divided into two broad classes of individual: 1) those who wanted to try and understand oil resources, reserves, production and depletion rates based on a myriad of data sets and analysis techniques with a view to predicting when peak oil may occur and 2) those who speculated about the consequences of peak oil upon society. Such speculation normally warned of dire consequences of a world running short of transport fuel and affordable energy leading to resource wars and general mayhem. And none of this ever came to pass unless we want to link mayhem in Iraq*, Syria, Yemen, Sudan and Nigeria to high food prices and hence peak oil. In which case we may also want to link the European migrant crisis and Brexit to the same.

[* One needs to recall that GWI was precipitated over Kuwait stealing oil from Iraq, from a shared field on the Kuwait-Iraq border, leading to the Iraqi invasion of 1991.]

The peak oil debate on The Oil Drum was a lightning conductor for doomers of every flavour – peak oil doom (broadened to resource depletion doom), economic doom and environmental doom being the three main courses on the menu. The discussion was eventually hijacked by Greens and Green thinkers, who, not content with waiting for doomsday to happen, set about manufacturing arguments and data to hasten the day. For example, fossil fuel scarcity has morphed into stranded fossil fuel reserves that cannot be burned because of the CO2 produced, accompanied by recommendations to divest fossil fuel companies from public portfolios. Somewhat surprisingly, these ideas have gained traction in The United Nations, The European Union and Academia.

It is not my intention to dig too deeply into the past. Firmly belonging to the group of data analysts, in this post I want to take a look at two different data sets to explore where peak oil stands today. Is it dead and buried forever, or is it lurking in the shadows, waiting to derail the global economy again?


The USA and Hubbert’s Peak


The USA once was the poster child of peak oil. The Peak Oil theory was first formulated there by M. King Hubbert who in 1956 famously forecast that US production would peak around 1970 and thereafter enter an era of never-ending decline (Figure 1). Hubbert’s original paper is well worth a read.

Figure 1 From Hubbert’s 1956 paper shows the peak and fall in US production for ultimate recovery of 150 and 200 billion barrels. The 200 billion barrel model shows a peak of 8.2 Mbpd around 1970 that proved to be uncannily accurate.

Looking to Figure 2 we see that Hubbert’s prediction almost came true. US production did indeed peak in 1970 at 9.64 Mbpd while Hubbert’s forecast was a little lower at 8.2 Mbpd. The post-peak decline was interrupted by the discovery of oil on the N slope of Alaska and opening of the Aleyska pipeline in 1977 that was not considered in Hubbert’s work. Herein lies one of the key weaknesses of using Hubbert’s methodology. One needs to take into account known unknowns. We know for sure that unexpected discoveries and unexpected technology developments will occur, it’s just we don’t know, what, when and how big.

Figure 2 In red, US crude oil production from the EIA shows progressive growth from 1900 to 1970. The oil industry believed this growth would continue forever and was somewhat aghast when M. King Hubbert warned the party may end in 1970 which it duly did. The discovery of oil in Alaska created a shoulder on the decline curve. But apart from that, Hubbert’s forecast remained good until 2008 when the shale drillers and frackers went to work. Hubbert’s 1970 peak was matched by crude oil in 2015 and exceeded by C+C+NGL that same year.

Following the secondary Alaska peak of 8.97 Mbpd (crude oil) in 1985, production continued to decline and reached a low of 5 Mbpd (crude oil) in 2008. But since then, the rest is history. The shale drillers and frackers went to work producing an astonishing turnaround that most peak oil commentators, including me, would never have dreamt was possible.

Before going on to contemplate the consequences of the shale revolution, I want to dwell for a moment on the production and drilling activity in the period 1955 to 1990. 1955 to 1970 we see that total rigs* declined from 2683 to 1027. At the same time crude oil production grew from 6.8 to 9.6 Mbpd. It was in 1956 that Hubbert made his forecast and in the years that followed, US production grew by 41% while drilling rigs declined by 62%. No wonder the industry scoffed at Hubbert.

[* Note that Baker Hughes’ archive pre-1987 does not break out oil and gas rigs from the total.]

But then post 1970, as production went into reverse, the drilling industry went into top gear, with operational rigs rising sharply to a peak of 3974 in 1981. But to no avail, production in the contiguous 48 states (excluding Alaska) continued to plunge no matter how hard the oil and its drilling industry tried to avert it. Hubbert must surely have been proven right, and his methodology must surely be applicable not only to the US but to the World stage?

The oil price crash of 1981 put paid to the drilling frenzy with rig count returning to the sub-1000 unit baseline where it would remain until the turn of the century. The bear market in oil ended in 1998 and by the year 2000, the US drilling industry went back to work, drilling conventional vertical wells at first but with horizontal drilling of shale kicking in around 2004/05. Production would turn around in 2009.

Those who would speak out against peak oil in the mid-noughties, like Daniel Yergin and Mike Lynch, would argue that high price would result in greater drilling activity and technical innovation that would drive production to whatever level society demanded. They would also point out that new oil provinces would be found, allowing the resource base to grow. And they too must surely have been proved to be correct.

But there is a sting in the tail of this success story since drilling and producing from shale is expensive, it is dependent upon high price to succeed. But over-production of LTO has led to the price collapse, starving the shale drilling industry of cash flow and ability to borrow, leading to widespread bankruptcy. In fact informed commentators like Art Berman and Rune Likvern have long maintained that the shale industry has never turned a profit and has survived via a rising mountain of never ending debt. Economists will argue, however, that improved technology and efficiency will reduce costs and make shale competitive with other sources of oil and energy. We shall see.

Herein lies a serious conundrum for the oil industry and OECD economies. They may be able to run on shale oil (and gas) for a while at least, but the industry cannot function properly within current market conditions. Either prices need to be set at a level where a profit can be made, or production capped to protect price and market share. This of course would stifle innovation and is not likely to happen until there are queues at gas stations.


2008-2015 Winners and Losers


BP report oil production data for 54 countries / areas including 5 “other” categories that make up the balance of small producers in any region. I have deducted 2008 production (barrels per day) from 2015 production and sorted the data on the size of this difference. The data are plotted in Figure 3.

Figure 3 The oil production winners to the left and losers to the right, 2008 to 2015. The USA is the clear winner while Libya is the clear loser. About half of the countries show very little change. Click chart for a large readable version.

What we see is that production increased in 27 countries and decreased in the other 27 countries. One thing we can say is that despite prolonged record-high oil price, production still fell in half of the world’s producing countries. We can also see that in about half of these countries any rise or fall was barely significant and it is only in a handful of countries at either end of the spectrum where significant gains and losses were registered. Let’s take a closer look at these.

Figure 4 The top ten winners, 2008 to 2015.

The first thing to observe from Figure 4 is that the USA and Canada combined contributed 7.096 Mbpd of the 8.852 Mbpd gain 2008-2015. That is to say that unconventional light tight oil (LTO) production from the USA and LTO plus tar sands production from Canada make up 80% of the global gain in oil production (C+C+NGL). Iraq returning to market in the aftermath of the 2003 war makes up 18%. In other words expensive unconventional oil + Iraq makes up virtually all of the gains although concise allocation of gains and losses is rather more complex than that. Saudi Arabia, Russia, The UAE, Brazil, China, Qatar and Colombia have all registered real gains (5.258 Mbpd) that have been partly cancelled by production losses elsewhere.

Figure 5 The top ten losers, 2008 to 2015.

Looking to the losers (Figure 5) we see that Libya, Iran, Syria, Sudan and Yemen contribute 2.828 Mbpd of lost production that may be attributed to war, civil unrest or sanctions. I am not going to include Venezuela and Algeria with this group and will instead attribute declines in these countries (0.979 Mbpd) to natural reservoir depletion, although a slow down in OECD technical assistance in these countries may have exacerbated this situation. That leaves the UK, Mexico and Norway as the three large OECD producers that register a significant decline (1.687 Mbpd) attributed to natural declines in mature offshore provinces. Let me try to summarise these trends in a balance sheet:

Figure 6 The winner and loser balance sheet.

We see that these 20 countries account for 8.463 Mbpd net gain compared with the global figure of 8.85 Mbpd. We are capturing the bulk of the data and the main trends. In summary:

  • Unconventional LTO and tar sands + 7.096 Mbpd
  • Net conventional gains + 2.592 Mbpd
  • Net conflict losses -1.225 Mbpd

The sobering point here for the oil industry and society to grasp is that during 8 years when the oil price was mainly over $100/bbl, only 2.592 Mbpd of conventional production was added. That is about 3.1%. Global conventional oil production was all but static. And the question to ask now is what will happen in the aftermath of the oil price crash?

One lesson from recent history is that the oil industry and oil production had substantial momentum. It is nearly two years since the price crash, and while global production is now falling slowly it remains in surplus compared with demand. This has given the industry plenty time to cut staff, drilling activity and to delay or cancel projects that depend upon high price. In a post-mature province like the North Sea, the current crisis will also hasten decommissioning. It seems highly likely that momentum on the down leg will be replaced by inertia on the up leg with a diminished industry unwilling to jump back on the band wagon when price finally climbs back towards $100 / bbl, which it surely will do one day in the not too distant future.

For many years I pinned my colours to peak oil occurring in the window 2012±3 years. Noting that the near-term peak was 97.08 Mbpd on July 15 2015 it is time to dust off that opinion (Figure 7). The decline since the July 2015 peak is of the order 2% per annum (excluding the Fort McMurray impact). It seems reasonable to presume that this decline may continue for another two years, or even longer. That would leave global production at around 92 Mbpd mid 2018. It is nigh impossible to predict what will happen, especially in a world over run by political and economic uncertainty. Another major spike in oil price seems plausible and this could perhaps destabilise certain economies, banks and currencies. Should this occur, another price collapse will follow, and it’s not clear that production will ever recover to the July 2015 peak. Much will depend upon the future of the US shale industry and whether or not drilling for shale oil and gas gains traction in other countries.

Figure 7 The chart shows in blue global total liquids production (C+C+NGL+refinery gains+biofuels) according to the Energy Information Agency (EIA). The near term peak was 97.08 Mbpd in July 2015. The decline since then, excluding the Fort McMurray wild fire impact, is of the order 2% per annum. In the current low price environment, it is difficult to see anything arresting this decline before the end of next year. In fact, decline may accelerate and go on beyond the end of 2017. The dashed line shows the demand trajectory and scheduled balancing of supply and demand by the end of this year. By the end of next year the supply deficit could be of the order 3 Mbpd which on an annualised basis would result in a stock draw of 1.1 billion barrels. But remember, forecasts are ten a penny 🙂


Concluding Thoughts


  1. M. King Hubbert’s forecast for US oil production and the methodology it was based on has been proven to be sound when applied to conventional oil pools in the USA. When decline takes hold in any basin or province, it is extremely difficult to reverse even with a period of sustained high price and the best seismic imaging and drilling technology in the world.
  2. On this basis we can surmise that global conventional oil production will peak one day with unpredictable consequences for the global economy and humanity. It is just possible that the near term peak in production of 97.08 Mbpd in July 2015 may turn out to be the all-time high.
  3. Economists who argued that scarcity would lead to higher price that in turn would lead to higher drilling activity and innovation have also been proven to be correct. Much will depend upon Man’s ability to continue to innovate and to reduce the cost of drilling for LTO in order to turn a profit at today’s price levels. If the shale industry is unable to turn a profit then it will surely perish without State intervention in the market.
  4. But from 2008 to 2015, oil production actually fell in 27 of 54 countries despite record high price. Thus, while peak oil critics have been proven right in North America they have been proven wrong in half of the World’s producing countries.
  5. Should the shale industry perish, then it becomes highly likely that Mankind will face severe liquid fuel shortages in the years ahead. The future will then depend upon substitution and our ability to innovate within other areas of the energy sector.


Related reading:


From Rune Likvern:

The Bakken LTO extraction in Retrospect and a Forecast of Near Future Developments

Bakken(ND) Light Tight Oil Update with Sep 15 NDIC Data

Are the Light Tight Oil (LTO) Companies trying to outsmart Mother Nature with their Financial Balance Sheets?

From Enno Peters:

Visualizing US shale oil production

May 222014
 
 May 22, 2014  Posted by at 10:49 am Earth Tagged with: , , ,  14 Responses »


Dorothea Lange Sons of Negro tenant farmer, Granville County, North Carolina July 1939

This is the second installment of Nicole’s series on food security.

Nicole Foss: In part one of this series, we looked at finance as a major causal factor in the development of food insecurity. The boom and bust cycles that result from over-financialization are, however, only one aspect of a food crisis already present for many, and looming for many more in the years to come. Finance can, and does, generate artificial scarcity, initially through the manipulation of land and commodities for profit and, and latterly by over-reaching itself and crashing the human operating system, with tremendous negative impact on the supply of all goods and services. Food is one of the vital factors that will be substantially affected in a financial crash where connecting producers and consumers will be extremely difficult due to lack of money in circulation.

The inherent instability of our human operating systems is only one of a large number of limiting factors for food production and distribution. The very real scarcity coming as a result of limiting factors grounded in the physical world is far more serious in the longer term. While we can make changes capable of addressing both human and physical limits, we are highly unlikely to do so in a timeframe, or on a scale, that would prevent us from experiencing the consequences of of over-shooting our natural carrying capacity. Nevertheless, whatever we can achieve in the time available will be an improvement.

This series is not meant to be a comprehensive assessment of each limiting factor in relation to food supply, but an overview of vulnerability in its many forms, clarifying the imperative for re-engineering our food systems. Given the extent of the over-stretch of the current model, the possibility of rapid collapse in response to very predictable system shocks is uncomfortably high. We are at risk of cascading system failure. We cannot expect facilitation of this transition to come from the top down, however – far from it. The larger scale centralized human construct, highly over-stretched and inflexible, can only be expected to look after itself and defend the status quo at the expense of decentralization initiatives. Meaningful change will have to come from the bottom up, one local initiative at a time.

There is a considerable urgency to making this transition to a human-scale food system. While many are generally aware that our current means of producing and distributing food is unsustainable, few seem to realize that what cannot continue will not continue, that the limits are already being reached, and that the effects will most certainly be felt in our lifetimes, even in what are now wealthy countries. This is not an issue where we can continue business as usual and expect the impact to be felt only by distant populations or by subsequent generations. It will be one where we must take personal responsibility for change, both for our own benefit and that of society in general.

We are facing non-negotiable physical limits in terms of water and climate, which are the subject of this instalment, but also energy, soil fertility and carrying capacity, the subjects for the next part of the series. Our human systems for trade and agricultural regulation are frequently exacerbating the scope of the problems we face and will be covered subsequently. Ultimately we are going to have to face the root of the problem, which lies in the inherently expansionist nature of agriculture itself, as practiced not just in the industrial age, but from the dawn of the neolithic period. We will need to develop polycultural food production systems along permaculture lines if we are to avoid the worst consequences of over-reach. We will need to learn to live within limits.


Farming and Water

Fresh, clean water is the ultimate precious resource – the lifeblood of the planet – yet it is increasingly scarce in many places already and set be become far scarcer in the foreseeable future. Only a tiny percentage of the Earth’s fresh water is sufficiently accessible to be available for human use, and of that, agriculture consumes the lion’s share. It takes 1000 tons of water to grow a ton of wheat for instance.

Irrigated land is far more productive in the short term, allowing us to use the cheap energy we have had access to to expand the areas under cultivation and increase yields in order to feed our expanding population. However, in the longer term, irrigation leads to soil water-logging and salinization, as evaporation of mineralized water leaves salts behind in the soil. Land can be badly damaged and eventually abandoned, while new land is then subjected to the same treatment:

Although only 17% of all cropland is currently irrigated, it provides 40% of the world’s food….But much existing irrigated land is threatened by salinization — a build-up of salts in the soil. This lowers yields and can damage the land beyond economic repair. Salinization is reducing the world’s irrigated area by 1-2% every year, hitting hardest in the arid and semi-arid regions. “No one is really certain of the figures, but it seems that at least 8% of the world’s irrigated land is affected,” says FAO water expert Julián Martínez Beltrán. “In the arid and semi-arid regions, it’s somewhere around 25%.”

In this way, land is being consumed as a non-renewable resource. Needless to say, there is a finite supply of land available, and with irrigation damage occurring most quickly in the most water-stressed regions, the risk of food insecurity is compounded.

Some 60% of irrigation draws on surface water sources, but chronic over-use has led to major rivers no longer reaching the sea, destroying the health and productivity of formerly fertile delta lands which had previously been substantial food sources for local populations:

For six million years, the Colorado River ran its course from its soaring origins in the Rockies to a once-teeming two-million-acre delta, finally emptying 14 million acre-feet of fresh water into the Sea of Cortez. But now, a multitude of straws are drinking from the river….Indeed, the Colorado River has not reached the sea since 1998 but ends rather in a cracked and desolate expanse of barren mud flats and abandoned boats — a “dry river cemetery.”….

….Referred to as the Nile of North America, the Colorado River is the arid West’s lifeline. It provides water to more than 30 million Americans, including people in cities like Phoenix, Denver and Los Angeles. Over 100 dams and thousands of miles of canals divert the river to nearly every farm, industry and city within a 250-mile radius of its banks. It is one of the most diverted and dammed rivers in the world.

Dry Rivers are increasingly common worldwide.

Where irrigation depends on aquifers, draw-down often exceeds the natural recharge rate. We are depending on fossil water that is also effectively a non-renewable resource, and when the limit of feasible extraction is reached, whole regions are at risk of becoming unable to support either the human population or what remains of the existing ecosystem. Water tables are falling by several feet per year in many parts of the developing world dependent on groundwater sources, notably beneath rapidly growing urban centres with an insatiable demand for water, but also beneath agricultural regions:

Shijiazhuang, China — Hundreds of feet below ground, the primary water source for this provincial capital of more than two million people is steadily running dry. The underground water table is sinking about four feet a year. Municipal wells have already drained two-thirds of the local groundwater. Above ground, this city in the North China Plain is having a party. Economic growth topped 11% last year. Population is rising. A new upscale housing development is advertising waterfront property on lakes filled with pumped groundwater. Another half-built complex, the Arc de Royal, is rising above one of the lowest points in the city’s water table. “People who are buying apartments aren’t thinking about whether there will be water in the future,” said Zhang Zhongmin, who has tried for 20 years to raise public awareness about the city’s dire water situation….

….The North China Plain undoubtedly needs any water it can get. An economic powerhouse with more than 200 million people, it has limited rainfall and depends on groundwater for 60% of its supply….But scientists say [the aquifers] below the North China Plain may be drained within 30 years.

The same phenomenon is occurring under the major breadbaskets of the world, for instance the Punjab in India and the Ogallala Aquifer underlying the great plains of the US:

The Ogallala Aquifer, the vast underground reservoir that gives life to these fields, is disappearing. In some places, the groundwater is already gone. This is the breadbasket of America—the region that supplies at least one fifth of the total annual U.S. agricultural harvest. If the aquifer goes dry, more than $20 billion worth of food and fiber will vanish from the world’s markets. And scientists say it will take natural processes 6,000 years to refill the reservoir….

….With a liquid treasure below their feet and a global market eager for their products, farmers here and across the region have made a Faustian bargain—giving up long-term conservation for short-term gain. To capitalize on economic opportunities, landowners are knowingly “mining” a finite resource.

As with so many aspects of our human systems, short term gains trumps long term ability to provide that which sustains existence. Unfortunately, as the shared resource diminishes, competition over what remains intensifies, and the potential for conflict increases enormously. Resources previously used in common often become privatized and used for the exclusive benefit of a dominant group. The land grabs we discussed in relation to financial aspects of food insecurity are also reflections of this competition over water resources, and in fact are often water grabs in disguise:

Water grabbing refers to situations where powerful actors are able to take control of or divert valuable water resources and watersheds for their own benefit, depriving local communities whose livelihoods often depend on these resources and ecosystems. The ability to take control of such resources is linked to processes of privatisation, commodification and take-over of commonly-owned resources. They transform water from a resource openly available to all into a private good whose access must be negotiated and is often based on the ability to pay. Water grabbing thus appears in many different forms, ranging from the extraction of water for large scale food and fuel crop monocultures, to the damming of rivers for hydroelectricity, to the corporate takeover of public water resources….

….The causes of water grabbing are similar to those of ‘land grabbing’: the phenomenon whereby investors acquire or lease vast tracts of land, with negative socio-economic and environmental effects. An investor’s control of land usually comes with a corresponding control of water resources. Indeed, access to water could be the most valuable part of the deal. This is especially so given that host governments seek to entice investors by offering them concessions with regards to water use….

….Acquiring land in order to access and control water is especially relevant to countries facing water scarcity. Renewable water resources in the Gulf states for example are set to run out in the next three decades. The implications of this water scarcity are profound. Saudi Arabia, once a net exporter of wheat, intends to phase out domestic production of wheat by 2016 due to the depletion of fresh water reserves in the country. It seeks to compensate for this loss in domestic food production by acquiring farmland abroad, thereby transferring much of the pressure on water resources caused by agricultural production to other countries. This is a strategy likely to be pursued by other water deficit countries as they seek to ‘lock in’ access to water reserves and resolve their own water constraints by acquiring land abroad.

The problem is compounded by the use to which acquired land is put, as this use, generally by absentee land owners, does not reflect a condition of resource scarcity. Water resources, which may already be under stress as local populations rise, are all too often being rapidly squandered in the pursuit of short term profit, with the result that ecosystems are damaged or destroyed and local populations forced to migrate:

All of the land deals in Africa involve large-scale, industrial agriculture operations that will consume massive amounts of water. Nearly all of them are located in major river basins with access to irrigation. They occupy fertile and fragile wetlands, or are located in more arid areas that can draw water from major rivers. In some cases the farms directly access ground water by pumping it up. These water resources are lifelines for local farmers, pastoralists and other rural communities. Many already lack sufficient access to water for their livelihoods. If there is anything to be learnt from the past, it is that such mega-irrigation schemes can not only put the livelihoods of millions of rural communities at risk, they can threaten the freshwater sources of entire regions.

The concept of virtual water trade refers to the quantity of water effectively exported when countries export agricultural products, which consume local water resources. Importing countries can save water at the expense of exporting ones:

When a country imports one tonne of wheat instead of producing it domestically, it is saving about 1,300 cubic meters of real indigenous water. If this country is water-scarce, the water that is ‘saved’ can be used towards other ends. If the exporting country is water-scarce, however, it has exported 1,300 cubic meters of virtual water since the real water used to grow the wheat will no longer be available for other purposes.

In 2007, the global water trade was estimated to be some 567 billion litres, double that in 1986 as the water trade has become increasingly globalized.


Exporting virtual water becomes problematic where exporting nations are water scarce. The decision to export virtual water anyway is generally a matter of short term economic gain, either for wealthy foreign purchasers of land, as we have seen in Africa, or for large domestic land owners. For instance, Australia is the driest inhabited continent, but also, according to UNESCO, the largest net exporter of virtual water in the world, with agricultural exports feeding 60 million people worldwide. This is currently possible due to the availability of the necessary energy to supply the water when and where needed, but it is obviously unsustainable. Australia has only just established an independent agency tasked with monitoring and setting sustainable limits on water use.

Similarly, drought-stricken California uses artificially cheap water provided with temporarily affordable energy to export thirsty hay and rice crops to Japan:

In the Imperial Valley of California, a region drier than part of the Sahara Desert, farmers have found a lucrative market abroad for a crop they grow with Colorado River water: They export bales of hay to land-poor Japan….Container ships from Japan unload electronics and other goods in the Port of Long Beach, and the farmers fill up the containers with hay for the trip back across the Pacific. Since the containers would otherwise return empty, it ends up costing less to ship hay from Long Beach to Japan than to California’s Central Valley.

“Everything is done for economics,” said Ronnie Leimgruber, an Imperial Valley hay grower who is expanding into the export market. “Japan cannot get hay cheaper. The freight is cheaper from Long Beach than from anywhere else in the world.” Water is cheap for valley farmers, too: urban rates there are four times as high. It costs only $100 to irrigate an acre of hay in the desert for a year. But what makes economic sense to farmers may not be rational behavior for California in the third year of a severe drought, say some conservationists. At the very least, they contend, the growing state debate over water allocation should take into account the exports of crops such as hay and rice — two of the most water-intensive crops in the West — because they take a toll on local rivers and reservoirs.

“This is water that is literally being shipped away,” said Patrick Woodall, research director at Food and Water Watch, an international consumer advocacy group with headquarters in Washington, D.C. “There’s a kind of insanity about this. Exporting water in the form of crops is giving water away from thirsty communities and infringing on their ability to deal with water scarcity.”

Increasingly, limits are going to be reached and hard choices are going to have to be made. The current pursuit of individual or corporate economic benefit at the expense of rational resource use cannot continue where the resources in question are increasingly limited and therefore subject to competing interests. Those competing interests will increasingly make themselves know in a highly socially disruptive manner destined to force change.

Competition over water access is already inflaming regional tensions in areas of water scarcity, with unequal provision reflecting relative power. The powerless may be prevented, by lack of sufficient water, from growing food at all, cementing a state of dependency where the powerful hold hostage the ability to provide basic essentials:

Published Monday by the Ramallah-based human rights organization Al-Haq, “Water for One People Only: Discriminatory Access and ‘Water-Apartheid’ in the Occupied Palestinian Territory”, reports that Israel has claimed up to 89% of an underground aquifer that is largely located in the West Bank, giving Palestinians only access to the remaining 11%. The water grab has fueled increased discrepancy in water usage in the region with the 500,000 Jewish settlers consuming approximately six times the amount of water used by the 2.6 million Palestinians living in the West Bank—with the discrepancy growing even greater when agricultural water use is accounted for.
“There is a grave injustice in the division of water, and the results have been catastrophic,” Tawfiq Salah, mayor of West Bank village al-Khader, told Al-Monitor….

….Writing about the report, Al-Monitor’s Jihan Abdalla quotes Musa, a Palestinian father of six, who had attempted to build a rainwater cistern in his field before the Israeli authorities quickly issued it with a demolition order. Abdalla continues: Musa says if they had access to sufficient, affordable water, his family would be able to live off their ancestral field, selling their grapes, olives and fruit in nearby markets. That, he says, is the reason why Israeli authorities prevent them from building a cistern, and why they do not have any running water. “They don’t want us to plant or grow anything, they just want us to have barely enough water for drinking and that’s it,” Musa says looking at the unfinished, empty hole in the ground.

It is not only in situations of long term ethnic conflict where actions such as collecting rainwater for self-sufficiency are seen as competing with established interests. In drought prone regions of the US southwest, precious water rights are considered to be threatened by domestic rainwater capture, even though the water captured would otherwise have been more likely to have evaporated than to have made its way to the fully allocated river:

The Rocky Mountain state uses a convoluted mix of first-come, first-serve water rights, some of which date back to the 1850s, and riparian rights that belong to the owners of land lying adjacent to water. A single person catching rain wouldn’t make a difference to water rights holders, according to Brian Werner of the Northern Colorado Water Conservancy District. But if everyone in Denver captured rain, he says, that would upset the state’s 150-year-old water-allocation system. The Colorado Department of Natural Resources estimates that 86% of water deliveries go to agriculture, which is already stressed by dwindling supplies. And because 19 states and Mexico draw water from rivers that originate in the Colorado Rockies, backyard water harvesting can have widespread implications….

….With water systems across the country already highly or fully appropriated, and with drought aggressively depleting supplies, Aiken predicts that legal battles over who owns the rain won’t go away anytime soon. Old water-allocation systems remain in direct conflict with a growing movement for DIY water conservation, including rainwater collection.

Bulk water transfers are being contemplated in a number of locations, but these are highly controversial as they would have significant environmental impacts. They are so highly capital and energy intensive that limits on those parameters may prevent this kind of development, although it would depend on which critical resource first became limiting in a given location. Both farms and cities, increasingly competing for water in arid regions, could prioritize water over money and energy if the latter remain available.

An illustration of the emerging tension between critical resources can be seen in relation to the water requirements of fracking for unconventional fossil fuels:

The move to tap petroleum-rich shale reserves in some of the country’s driest regions, including Colorado, may be setting up a battle between oil and water. The water is needed for hydraulic fracturing, a process that pumps millions of gallons of sand and water into a well to crack the hard shale and release oil and gas. Nearly half of the 39,294 reported “fracked” wells drilled in the U.S. since 2011 are in regions with high or extreme water stress, according to a report by Ceres, an investor and environmental-advocacy group….

….In Colorado, 86% of the state’s water is used by agriculture. Municipalities and industry use 7.4%. While oil and gas companies have created a small market for water, it hasn’t had a major impact on farms, said Bill Midcap, a spokesman for the Rocky Mountain Farmers Union. “There are cases where companies have bid up water to more than farmers can afford, but it is in a few cases,” Midcap said.

Over-use of water sources and inappropriate or uncontrolled land use has had a substantial impact on water quality in many regions, damaging both surface water sources and also the oceans into which those surface waters emerge. Both urban pollution and agricultural runoff have major impacts. Fertilizers and animals wastes from agricultural land wash into water courses, causing eutrophication – the nutrient enrichment of the water to an extent that allows algal blooms to form. As these decay, the available oxygen is consumed, suffocating the inhabitants of the river and creating dead zones at river mouths. For instance, the one at the mouth of the Mississippi is the size of New Jersey.

Of China’s 23,000 miles of large rivers, 80% are no longer able to support fish and aquatic ecosystems are on the brink of collapse. This will have a profound effect on food security is the world’s most populous country. Of course, food security is hardly the only issue with regard to rampant mis-use of water resources. Water-borne diseases are also going to prove to be strongly limiting factors in many places where more and more people have no access to safe drinking water.

Given the critical nature of water availability for drinking, for food security and for ecosystem health, a global water crisis represents a systemic threat.


Farming and Climate:

Climate change is already proving to be a factor in food insecurity, and is likely to have an increasing impact over time. The effects are complex, interacting with, and exacerbating, other factors, most notably the availability of water. Water will be affected by climate disruption through melting glaciers reducing surface water, increased evaporation, shifting rainfall patterns, droughts, an increasing number of extreme weather events and instances of coastal flooding. Where changes happen relatively quickly, they are much more difficult to adapt to, particularly in places where the local food system is already operating near a number of limits. This could easily lead to conflict:

“Battles over water and food will erupt within the next five to 10 years as a result of climate change,” said World Bank President Jim Yong Kim of the IPCC report. “The water issue is critically related to climate change. People say that carbon is the currency of climate change, water is the teeth. Fights over water and food are going to be the most significant direct impacts of climate change.”

Droughts have have had an increasing impact in recent years, with the shifting of of atmospheric jet stream patterns being a contributing factor. These upper level rivers of air guide low pressure systems and determine the storm track, with its attendant rainfall patterns. Where there are jet stream disturbances, weather patterns can be substantially altered:

Scientists expect the amount of land affected by drought to grow by mid-century—and water resources in affected areas to decline as much as 30%. These changes occur partly because of an expanding atmospheric circulation pattern known as the Hadley Cell—in which warm air in the tropics rises, loses moisture to tropical thunderstorms, and descends in the subtropics as dry air. As jet streams continue to shift to higher latitudes, and storm patterns shift along with them, semi-arid and desert areas are expected to expand.

For instance, the historic drought in California this past winter is a reflection of exactly this dynamic in action:

From November 2013 – January 2014, a remarkably extreme jet stream pattern set up over North America, bringing the infamous “Polar Vortex” of cold air to the Midwest and Eastern U.S., and a “Ridiculously Resilient Ridge” of high pressure over California, which brought the worst winter drought conditions ever recorded to that state. A new study published this week in Geophysical Research Letters, led by Utah State scientist S.-Y. Simon Wang, found that this jet stream pattern was the most extreme on record, and likely could not have grown so extreme without the influence of human-caused global warming. The study concluded, “there is a traceable anthropogenic warming footprint in the enormous intensity of the anomalous ridge during winter 2013-14, the associated drought and its intensity.”

California is a major food producing region, and the lack of water is already reducing production, with on-going effect.

Farmers in the state probably will leave as much as 500,000 acres unplanted, or about 12% of last year’s principal crops, because they won’t have enough water to produce a harvest, which will mean fewer choices and higher prices for consumers, said Mike Wade, executive director of the California Farm Water Coalition, a Sacramento-based group of farmers, water district managers and farm-related businesses. “Any job that’s associated with agriculture is hurting,” Wade said. While some farmers were able to conserve water in years past, they won’t get “any preferential treatment” over uses by municipalities, he said.

Extreme weather around the world is wreaking havoc with farmers and threatening global food production. Dry weather in China turned the world’s second-biggest corn grower into a net importer of the grain in 2010, and ranchers in Texas have yet to recover from a record dry spell three years ago. One in eight people in the world go hungry, some of which can be blamed on drought, according to the United Nations.

Although California is a relatively wealthy place, food security is affecting an increasing number of people as the financial bubble leaves more and more people behind, unable to keep up with a treadmill that keeps running faster and faster. As a result, the drought is impacting food security for the poorest residents:

The effects of California’s drought could soon hit the state’s food banks, which serve 2 million of its poorest residents. Fresh produce accounts for more than half the handouts at Bay Area food banks, but with an estimated minimum of 500,000 acres to be fallowed in California, growers will have fewer fruits and vegetables to donate.

With less local supply, food prices will spike, increasing as much as 34% for a head of lettuce and 18% for tomatoes, according to an Arizona State University study released last week. With fewer fields planted, there could be as many as 20,000 unemployed agricultural workers who will need more food handouts, especially in the Central Valley. And if urban food banks like those in Oakland and San Francisco can’t get produce from the valley, which grows a third of the nation’s fruits and vegetables, their transportation costs to haul in out-of-state produce will soar.

Jet stream fluctuations are now driving the development of dangerous heat conditions further inland, exacerbating persistent drought conditions reminiscent of the 1930s. In fact the US Department of Agriculture has recently issued what is effectively a dust bowl warning:

Meanwhile, US Department of Agriculture officials issued a warning Tuesday that conditions in the US Heartland were rapidly deteriorating along lines last seen during the infamous 1930s Dust Bowl as expectations for the US domestic winter wheat crop again fell after the USDA’s most recent agricultural tour.

Even prior to the extreme early May heatwave emerging over the Central US Sunday, Monday and Tuesday, the% of the US wheat crop in either good or excellent condition had fallen another 2% to 31% late last week. Meanwhile, crops listed as ‘very poor’ rocketed from an already abysmal 34% to 39% over the same period. The net result is that the US wheat crop is in its worst condition since at least 1996, according to findings by Commerzbank analysts.

For Oklahoma, at the epicenter of current agricultural harm and flash heatwaves, only 6% of the state’s entire wheat crop was listed as in either good or excellent condition. Department of Agriculture crop scouts described the Oklahoma situation in, perhaps, the starkest possible terms during their most recent report stating: “Producers in the Panhandle continued to experience high winds … and low moisture conditions similar to the Dust Bowl in the 1930s.” Overall, analysts now expect a US wheat crop of just 762 million bushels, the third lowest in 15 years despite record areas planted.

In other parts of the world, climate-driven changes in rainfall patterns over longer periods could have catastrophic effects where rain is highly seasonal and the food security of very large numbers of people depends on its regularity. For instance, the Indian summer monsoon is critical for farming in a country of over a billion people, but is predicted to be significantly affected in a future of rising temperatures:

Global warming could cause frequent and severe failures of the Indian summer monsoon in the next two centuries, new research suggests. The effects of these unprecedented changes would be extremely detrimental to India’s economy which relies heavily on the monsoon season to bring fresh water to the farmlands. The findings have been published November 6, in IOP Publishing’s journal Environmental Research Letters, by researchers at the Potsdam Institute for Climate Impact Research and Potsdam University….

….The Walker circulation usually brings areas of high pressure to the western Indian Ocean but, in years when El Niño occurs, this pattern gets shifted eastward, bringing high pressure over India and suppressing the monsoon, especially in spring when the monsoon begins to develop. The researchers’ simulations showed that as temperatures increase in the future, the Walker circulation, on average, brings more high pressure over India, even though the occurrence of El Niño doesn’t increase.

Unfortunately, surface water resources in both India and China will also be badly affected by the on-going melting of the Himalayan glaciers, with additive effect:

The world is now facing a climate-driven shrinkage of river-based irrigation water supplies. Mountain glaciers in the Himalayas and on the Tibet-Qinghai Plateau are melting and could soon deprive the major rivers of India and China of the ice melt needed to sustain them during the dry season. In the Ganges, the Yellow, and the Yangtze river basins, where irrigated agriculture depends heavily on rivers, this loss of dry-season flow will shrink harvests.

The world has never faced such a predictably massive threat to food production as that posed by the melting mountain glaciers of Asia. China and India are the world’s leading producers of both wheat and rice — humanity’s food staples. China’s wheat harvest is nearly double that of the United States, which ranks third after India. With rice, these two countries are far and away the leading producers, together accounting for over half of the world harvest.

The Intergovernmental Panel on Climate Change reports that Himalayan glaciers are receding rapidly and that many could melt entirely by 2035. If the giant Gangotri Glacier that supplies 70% of the Ganges flow during the dry season disappears, the Ganges could become a seasonal river, flowing during the rainy season but not during the summer dry season when irrigation water needs are greatest.

The combination of shifting seasonal rainfall, disappearing glacial meltwater, and the falling water tables already discussed adds up to a major predicament for Asian food security going forward:

Asia is home to some of the world’s biggest natural-disaster hot spots, and no other continent is more prone to the cumulative impact of droughts, flooding and large storms. This fragility is compounded by the region’s unmatched population size and density, and its concentration of people living in deltas and other low-lying regions.

The specter of a hotter, drier future for Asia can be seen in the degradation of watersheds, watercourses and other ecosystems, as well as in the shrinking forests and swamps and over-dammed rivers. Such developments undermine the region’s hydrological and climatic stability, fostering a cycle of chronic droughts and flooding. To make matters worse, Asia is likely to bear the brunt — as the report by the U.N. Intergovernmental Panel on Climate Change warns — of the global effects of extreme weather, rising seas and shortages of drinking water. Water wars may only be a matter of time.

Asia’s droughts are becoming longer and more severe, and the availability of water per capita is declining at a rate of 1.6% a year. This is a troubling trend for a region where agriculture alone guzzles 82% of the annual water supply. The rapid spread of irrigation since the 1960s has helped turn a continent once plagued by food shortages and famines into a food exporter. But it has also exacted a heavy toll on the environment and resources.

Higher temperature in many locations are also set to lead to substantially higher rates of evaporation, compounding the problem:

Sure, scientists expect the changing climate to bring on more drought. There’s going to be less rainfall in already arid regions, that’s fairly certain. And that alone would be bad news for denizens of the planet’s dry zones—in some places in North Africa, the American Southwest, India, and the Middle East, water shortages could well become an existential threat to civilization. But new research shows that evaporation may be more of a problem than previously thought: Climate change could dry out up to a third of the planet.

The study, published in the journal Climate Dynamics last month, estimates that climate change will cause reduced rainfall alone to dessicate 12% of the Earth’s land by 2100. But if evaporation is factored in, the study’s authors say that it will “increase the percentage of global land area projected to experience at least moderate drying by the end of the 21st century from 12 to 30%.”

“We know from basic physics that warmer temperatures will help to dry things out,” the study’s lead author, Benjamin Cook, a climate scientist with Columbia University and NASA’s Goddard Institute for Space Studies, said in a statement. “Even if precipitation changes in the future are uncertain, there are good reasons to be concerned about water resources.”

Writing in a 2011 literature review in the science journal Nature, the physicist Joe Romm elaborates on how increased heat and evaporation can lead to a vicious cycle: “Precipitation patterns are expected to shift, expanding the dry subtropics. What precipitation there is will probably come in extreme deluges, resulting in runoff rather than drought alleviation. Warming causes greater evaporation and, once the ground is dry, the Sun’s energy goes into baking the soil, leading to a further increase in air temperature.”

Disappearing soil moisture is likely to be a greater problem than previously thought, and the occasional downpour won’t sate year-round crops. As Columbia University notes, “An increase in evaporative drying means that even regions expected to get more rain, including important wheat, corn, and rice belts in the western United States and southeastern China, will be at risk of drought.”

Australia, already the driest continent, is set to become drier as a result of reduced rainfall and higher evaporation. While the continent  current produces a huge excess of food for export, it’s ability to continue doing so is likely to be substantially compromised in an increasingly arid future:

Australia emerged from a decade-long drought in 2009, which was said to be the worst in the country’s history. The report states the drought was estimated to have caused an 80% reduction in grain production and a 40% reduction in livestock production, and climate models predict that rainfall in southern and eastern Australia will continue to decrease as the century progresses.

Increasing aridity can lead to additional risks, notably the threat of wildfires. California is facing a potentially catastrophic fire season this year following on from its recent drought:

Even before this year’s drought, forest officials were reporting a longer fire season, and more catastrophic mega-fires, in California and other western states. Half of the worst fires in recorded Californian history have occurred since 2002. Climate change and land-use patterns are adding fuel to those fires. Higher temperatures, with recurring and intensifying droughts are drying out landscapes. Pest invasions, such as the pine bark beetle, have killed off stands of trees.

California’s state fire chief, Ken Pimlott, said: “We can’t recall when we have seen this level of fire activity early in this year. “This is usually the time of year when much of the state is greening up. We haven’t even got into the months that historically are the worst in California – late August, September and October – so that’s a big red flag right there.”

Similarly, Australia is facing increased risk of major conflagrations as climatic shifts cause further drying. There have been an increasing number of hot, dry and windy days over the last 30 years, amounting to greatly increased fire risk. The country only recently emerged from the worst drought in its history, which was accompanied by huge fires. Fire has always been a feature of the arid landscape, reflected in the fire tolerance of many trees, but not on the scale seen in recent years. These intense fires are a far bigger threat. They incinerate all before them and remove all the oxygen from the air as they pass by:

The 2009 Black Saturday bushfires in Victoria were also preceded by extreme fire danger conditions: a decade-long drought and a number of record hot years, all compounded by a heatwave in the week prior. The ferocity of these fires was unprecedented, and so severe were they that they broke the record for the Forest Fire Danger Index, and a new category – ”catastrophic” or ”code red” – was added. Worryingly, since 2009, we have experienced more days of ”catastrophic” fire danger, and this number will very likely increase in the future. Fire frequency and intensity is also predicted to increase in already fire-prone areas – areas in which a large proportion of the Australian population lives. We are now also seeing the season of bushfire weather lengthening from October to March, and this will continue to extend in future….

….So, while bushfires are part of the Australian story, more intense and frequent bushfires are part of the Australian climate change story. The current environment in which we experience bushfires is changing. The lengthened bushfire season, and increased frequency and intensity of heatwaves, mean that the overall risk of bushfires in Australia has amplified.

Bushfires are capable of wiping out areas of food production. This is of particular concern for tree crops which take many years to re-establish. Intense fires can also cause soil damage.

Apart from the problem of too little water, climate change can also lead to too much. Flooding can inflict enormous damage on food production, often in areas where food insecurity is already prevalent:

The impact of extreme weather events on food production and consumption are well documented. For example, extreme floods in Pakistan in 2010 destroyed an estimated two million hectares of crops, killed 40% of the livestock in affected areas, and delayed the planting of winter crops, causing the price of basic foods such as rice and wheat to rocket. As a consequence, an estimated eight million people reported eating less food and less nutritious food over an extended period of time.

Increasingly intense storms can bring deluges, but also damaging winds and storm surges high enough to cause serious coastal flooding. For instance, Typhoon Haiyan, which hit the Philippines in late 2013 was the most powerful to make landfall since records began, with winds reaching 310km/h. While one cannot say definitively that any one event is caused by climate change, warmer air and oceans, leading to greater evaporation and therefore more moisture in unstable air masses, would be expected to raise the probability of increasingly intensity of storm events. Storms draw their energy from warm water, and their impact is enhanced by rising sea levels, the disappearance of protective coastal wetlands and coastal over-development.

Storms threaten not only land crops, but also the biologically diverse and highly productive coastal food production relied upon by so many people. Some 95% of marine food production originates from coastal ecosystems, but damage to mangrove forests and coastal wetlands destroys spawning and feeding grounds for fisheries.

Increasing temperature, even in the absence of acute threats such as drought, wildfires and severe storms, are capable of lowering crops yields, particularly for grains:

Warmer temperatures may make many crops grow more quickly, but warmer temperatures could also reduce yields. Crops tend to grow faster in warmer conditions. However, for some crops (such as grains), faster growth reduces the amount of time that seeds have to grow and mature. This can reduce yields (i.e., the amount of crop produced from a given amount of land).

Yield declines are expected to be significant as heat and aridity increase:

“Almost everywhere you see the warming effects have a negative affect on wheat and there is a similar story for corn as well. These are not yet enormous effects but they show clearly that the trends are big enough to be important,” Lobell said. Wheat is the first big staple crop to be affected by climate change, because it is sensitive to heat and is grown around the world, from Pakistan to Russia to Canada. Projections suggest that wheat yields could drop 2% a decade….

….Declines in crop yields will register first in drier and warmer parts of the world but as temperatures rise two, three or four degrees, they will affect everyone. In the more extreme scenarios, heat and water stress could reduce yields by 25% between 2030 and 2049.

In addition, seasonal boundaries, and therefore vegetation zones, are shifting, which is making it far more difficult to produce food in the ways people have traditionally done in a given area:

Paul Roberts has been producing wine in Friendsville in Garrett County for 17 years. Last year, for the first time, his growing season began in March — six weeks earlier than the historical timeline. It was “unprecedented,” he said. For farmers and gardeners, climate change is making the art of coaxing a flower to blossom or fruit to grow precarious and unpredictable….

….A midwinter thaw or an early frost can kill many plants and ruin crops. With increasingly extreme and unpredictable weather due to climate change, plants’ health is at the whim of the weather. An early warm spell triggers fresh growth that is vulnerable to frost, Roberts said. When the growing season starts early, it means more nights for him to worry about the temperature dropping below freezing and damaging his crops….

…The mismatch of pollinators’ and plants’ schedules also threatens plants’ ability to reproduce and produce food. Plants and insects respond to changes in hours of sunlight and temperature. But if a pollinator emerges during an early temperature spike, the plants it pollinates may not be in blossom. Crops rely heavily on insects such as bees, whose populations have struggled in recent years.

Very rapid change can destabilize ecosystems in this way, as climate sensitivities for different species can vary. As prime growing temperatures shift to higher latitudes, they may no longer coincide with suitable soils and nutrients. In addition insect and plant pests may thrive without cold winters to control their populations. Novel pests may also invade with shifting temperature and humidity. Over time, land use patterns are expected to change as ecosystems shift:

Vegetation around the world is on the move, and climate change is the culprit, according to a new analysis of global vegetation shifts led by a University of California, Berkeley, ecologist in collaboration with researchers from the U.S. Department of Agriculture Forest Service….“This is the first global view of observed biome shifts due to climate change,” said the study’s lead author Patrick Gonzalez, a visiting scholar at the Center for Forestry at UC Berkeley’s College of Natural Resources. “It’s not just a case of one or two plant species moving to another area. To change the biome of an ecosystem, a whole suite of plants must change.”…

….Some examples of biome shifts that occurred include woodlands giving way to grasslands in the African Sahel, and shrublands encroaching onto tundra in the Arctic. “The dieback of trees and shrubs in the Sahel leaves less wood for houses and cooking, while the contraction of Arctic tundra reduces habitat for caribou and other wildlife,” said Gonzalez, who has served as a lead author on reports of the Intergovernmental Panel on Climate Change (IPCC). “Globally, vegetation shifts are disrupting ecosystems, reducing habitat for endangered species, and altering the forests that supply water and other services to many people.”

Important shifts with major implication for food security are happening not just on land, but also in the oceans. Climate change is compounding the impact of fish stocks collapsing due to over-fishing. Oceans are warming. This translates into rising sea levels due to thermal expansion, combined with the effect of melting glaciers and ice sheets. Ocean currents are being altered as temperature changes in the atmosphere drive changes in wind patterns and therefore surface currents, and ice melting changes the ocean density profile. As thermohaline circulation in the oceans provides nutrients through upwelling, changes have the potential to cause much damage to marine ecosystems by starving the base of the food chain.

Changes in ocean heat flow have the potential to alter the climate on land as well. For instance, a weaker Gulf Stream would be expected to cause substantial cooling in northern Europe. Cold periods in Europe’s past have been associated with a weaker Gulf Stream, and climate change is predicted to pose a risk this may happen to a greater extent:

“The strength of the Gulf Stream was about 10% weaker during the Little Ice Age,” David Lund, of the Massachusetts Institute of Technology/Woods Hole Oceanographic Institution, told Reuters. He and two colleagues studied sediment cores off Florida and the Bahamas, and found evidence of a weaker flow that may have contributed to the Little Ice Age from about 1200-1850, when Alpine glaciers grew and London’s Thames River froze. “The possibility of abrupt changes in Gulf Stream heat transport is one of the key uncertainties in predictions of climate change for the coming centuries,” the scientists wrote in the journal Nature.

In addition, ocean acidification, as the oceans absorb CO2 from the atmosphere, is also impacting at the base of the food chain, affecting the millions of small organisms increasingly unable to form their carbonate shells:

Ocean acidification is sometimes called “climate change’s equally evil twin,” and for good reason: it’s a significant and harmful consequence of excess carbon dioxide in the atmosphere that we don’t see or feel because its effects are happening underwater. At least one-quarter of the carbon dioxide (CO2) released by burning coal, oil and gas doesn’t stay in the air, but instead dissolves into the ocean. Since the beginning of the industrial era, the ocean has absorbed some 525 billion tons of CO2 from the atmosphere, presently around 22 million tons per day….

….When carbon dioxide dissolves in seawater, the water becomes more acidic and the ocean’s pH (a measure of how acidic or basic the ocean is) drops. Even though the ocean is immense, enough carbon dioxide can have a major impact. In the past 200 years alone, ocean water has become 30% more acidic—faster than any known change in ocean chemistry in the last 50 million years. Scientists formerly didn’t worry about this process because they always assumed that rivers carried enough dissolved chemicals from rocks to the ocean to keep the ocean’s pH stable. (Scientists call this stabilizing effect “buffering.”) But so much carbon dioxide is dissolving into the ocean so quickly that this natural buffering hasn’t been able to keep up, resulting in relatively rapidly dropping pH in surface waters. As those surface layers gradually mix into deep water, the entire ocean is affected….

….Reef-building corals craft their own homes from calcium carbonate, forming complex reefs that house the coral animals themselves and provide habitat for many other organisms. Acidification may limit coral growth by corroding pre-existing coral skeletons while simultaneously slowing the growth of new ones, and the weaker reefs that result will be more vulnerable to erosion. This erosion will come not only from storm waves, but also from animals that drill into or eat coral. By the middle of the century, it’s possible that even otherwise healthy coral reefs will be eroding more quickly than they can rebuild.

Coral bleaching, as a result of environmental stressors such as rising temperature and increasing acidification, is an indicator that highly productive marine ecosystems are under threat. Marine food webs can collapse, with reefs dying and top predators over-fished, leaving the simple organisms such as sea urchins and jellyfish to proliferate unchecked. This is a tragedy in its own right, but will inevitably have knock-on consequences for human food security as well, as so many people either make, or supplement, their living from the sea.

While specific climate impacts are only probabilistically predictable over the longer term, there is every reasons to think that these impacts are going to exacerbate the the problem of food security.


The Bottom Line

Water will be in increasingly short supply as more and more people attempt to provide for themselves in regions where the supply is diminishing and resources are being used at far greater than replacement rate. Climate change is expected to accentuate water shortages in many ways, as well as having destabilizing effects on ecosystems forced to shift latitude or altitude rapidly. The potential for conflict is already increasing, as we saw in part one of this series in relation to food prices. Water and climate change are going to add to the pressure, and this is likely to precipitate some very unfortunate situations.

Our relentless human expansion is running up against hard, non-negotiable limits to food security, which is already threatened in so many places. Our current extractive methods amount to a draw down of natural capital, allowing us to feed (most of) ourselves today, but in highly wasteful ways which are already compromising our ability to feed ourselves and our descendants tomorrow. Those in a position to do so chase short term economic gain at the expense of burning through non-renewable resources in ways which clearly make no sense with respect to any logic other than short term economic benefit. Those at the other end of the financial food chain also prioritize what could, in a sense, be called short term gain, but for them is in fact a matter of short term survival.

The next part of this series will address the equally pressing issues of energy, soil fertility and carrying capacity.